{"_id":"@arincen/charts","_rev":"5-8f5ea1ad6969c208df582bc263d8d4ea","name":"@arincen/charts","dist-tags":{"latest":"1.1.0"},"versions":{"1.0.0":{"name":"@arincen/charts","version":"1.0.0","keywords":["chart","charts","canvas","financial","candlestick","trading","stock","ai","agent","llm","accessible"],"author":{"name":"Arincen L.L.C-FZ"},"license":"MIT","_id":"@arincen/charts@1.0.0","maintainers":[{"name":"bahaakhateeb","email":"bahaay@arincen.com"}],"homepage":"https://en.arincen.com/arincen-charts","bugs":{"url":"https://github.com/arincen/arincen-charts/issues"},"dist":{"shasum":"b7cf4d09a176ed37911b4c83ff7459a8937c64b0","tarball":"https://registry.npmjs.org/@arincen/charts/-/charts-1.0.0.tgz","fileCount":44,"integrity":"sha512-SwS00Frk6HN3cZSwLbfYvjBWZKHsFanJCX9Fqc6lK4WK0fWRSvRUdHGEWtDfk9qLMVBxzSlFHMlZi5JYb44YUQ==","signatures":[{"sig":"MEUCIQC7YlMfXq+pLM0vdU6CEi4xjtiMNL3jP2ko11WdWp0QmQIgFAz8V38hqlncpOKPIpTQhwPG8OI4Eh7ogz4aMWgS4iU=","keyid":"SHA256:DhQ8wR5APBvFHLF/+Tc+AYvPOdTpcIDqOhxsBHRwC7U"}],"unpackedSize":1592581},"main":"./dist/index.mjs","type":"module","types":"./dist/types/index.d.ts","unpkg":"./dist/arincen-charts.standalone.js","module":"./dist/index.mjs","engines":{"node":">=18"},"exports":{".":{"types":"./dist/types/index.d.ts","import":"./dist/index.mjs","default":"./dist/index.mjs"},"./full":{"types":"./dist/types/full.d.ts","import":"./dist/full.mjs","default":"./dist/full.mjs"},"./standalone":"./dist/arincen-charts.standalone.js","./package.json":"./package.json","./standalone/full":"./dist/arincen-charts-full.standalone.js"},"gitHead":"26e52773c4a313d4a52a08ac0a9ac708341c77aa","_npmUser":{"name":"bahaakhateeb","email":"bahaay@arincen.com"},"jsdelivr":"./dist/arincen-charts.standalone.js","repository":{"url":"git+https://github.com/arincen/arincen-charts.git","type":"git"},"_npmVersion":"10.9.8","description":"A financial chart an AI agent can read: about 22 KB, zero dependencies. Two builds from one codebase, and toText/annotate so a model can describe the chart and draw its answer back.","directories":{},"sideEffects":false,"_nodeVersion":"22.22.3","publishConfig":{"access":"public"},"_hasShrinkwrap":false,"_npmOperationalInternal":{"tmp":"tmp/charts_1.0.0_1786450531840_0.1593819577226041","host":"s3://npm-registry-packages-npm-production"}},"1.0.1":{"name":"@arincen/charts","version":"1.0.1","keywords":["chart","charts","canvas","financial","candlestick","trading","stock","ai","agent","llm","accessible"],"author":{"name":"Arincen L.L.C-FZ"},"license":"MIT","_id":"@arincen/charts@1.0.1","maintainers":[{"name":"bahaakhateeb","email":"bahaay@arincen.com"}],"homepage":"https://en.arincen.com/arincen-charts","bugs":{"url":"https://github.com/arincen/arincen-charts/issues"},"dist":{"shasum":"097071cc8e5e8291cd7690f230543423e9305385","tarball":"https://registry.npmjs.org/@arincen/charts/-/charts-1.0.1.tgz","fileCount":44,"integrity":"sha512-5VZbIs5Se3BzxP9/X4iyt4U38Z04FcjRLUdzQSo5cYit6F7NOqkoZHYQoZtmKrMd3CXjPb5sFIDP7U/xTZJUNw==","signatures":[{"sig":"MEQCIAvPNaG8jkthGoX4TmQcA0RqAr4QSosB8CgPryjNUa1YAiBBn9d0pM/8WkZocM/bVmugMXCA5Mrn+Bl2SRuR7R8APw==","keyid":"SHA256:DhQ8wR5APBvFHLF/+Tc+AYvPOdTpcIDqOhxsBHRwC7U"}],"unpackedSize":1621632},"main":"./dist/index.mjs","type":"module","types":"./dist/types/index.d.ts","unpkg":"./dist/arincen-charts.standalone.js","module":"./dist/index.mjs","engines":{"node":">=18"},"exports":{".":{"types":"./dist/types/index.d.ts","import":"./dist/index.mjs","default":"./dist/index.mjs"},"./full":{"types":"./dist/types/full.d.ts","import":"./dist/full.mjs","default":"./dist/full.mjs"},"./standalone":"./dist/arincen-charts.standalone.js","./package.json":"./package.json","./standalone/full":"./dist/arincen-charts-full.standalone.js"},"gitHead":"9ecf79652a228e1cdb432e2ee4529bb814bf807e","_npmUser":{"name":"bahaakhateeb","email":"bahaay@arincen.com"},"jsdelivr":"./dist/arincen-charts.standalone.js","repository":{"url":"git+https://github.com/arincen/arincen-charts.git","type":"git"},"_npmVersion":"10.9.8","description":"A financial chart an AI agent can read: about 22 KB, zero dependencies. Two builds from one codebase, and toText/annotate so a model can describe the chart and draw its answer back.","directories":{},"sideEffects":false,"_nodeVersion":"22.22.3","publishConfig":{"access":"public"},"_hasShrinkwrap":false,"_npmOperationalInternal":{"tmp":"tmp/charts_1.0.1_1786457325543_0.1884063550813373","host":"s3://npm-registry-packages-npm-production"}},"1.0.2":{"name":"@arincen/charts","version":"1.0.2","keywords":["chart","charts","canvas","financial","candlestick","trading","stock","ai","agent","llm","accessible"],"author":{"name":"Arincen L.L.C-FZ"},"license":"MIT","_id":"@arincen/charts@1.0.2","maintainers":[{"name":"bahaakhateeb","email":"bahaay@arincen.com"}],"homepage":"https://en.arincen.com/arincen-charts","bugs":{"url":"https://github.com/arincen/arincen-charts/issues"},"dist":{"shasum":"3c671a91f785a1367fffb09f2040824ac1c2220a","tarball":"https://registry.npmjs.org/@arincen/charts/-/charts-1.0.2.tgz","fileCount":44,"integrity":"sha512-c/z7wFzR6YtEore43dbAN210iCCdQTgjNXHHd5RuY9SbRgIRxW6Nl8MDl+R1CKXR14FiguEnD8MLaKZnZcQILA==","signatures":[{"sig":"MEYCIQDFPkfxheNuSWpkAoAAPsN5zzajX6gtl8pj9hSUqFCa7wIhAJNDm27ziMF08efm4WDhlWarlqnh95Y2voXzOdAS9+gV","keyid":"SHA256:DhQ8wR5APBvFHLF/+Tc+AYvPOdTpcIDqOhxsBHRwC7U"}],"unpackedSize":1622707},"main":"./dist/index.mjs","type":"module","types":"./dist/types/index.d.ts","unpkg":"./dist/arincen-charts.standalone.js","module":"./dist/index.mjs","engines":{"node":">=18"},"exports":{".":{"types":"./dist/types/index.d.ts","import":"./dist/index.mjs","default":"./dist/index.mjs"},"./full":{"types":"./dist/types/full.d.ts","import":"./dist/full.mjs","default":"./dist/full.mjs"},"./standalone":"./dist/arincen-charts.standalone.js","./package.json":"./package.json","./standalone/full":"./dist/arincen-charts-full.standalone.js"},"gitHead":"d951f25bbb10ec6c29688176ded0d2a1c2042f1a","_npmUser":{"name":"bahaakhateeb","email":"bahaay@arincen.com"},"jsdelivr":"./dist/arincen-charts.standalone.js","repository":{"url":"git+https://github.com/arincen/arincen-charts.git","type":"git"},"_npmVersion":"10.9.8","description":"A financial chart an AI agent can read: about 22 KB, zero dependencies. Two builds from one codebase, and toText/annotate so a model can describe the chart and draw its answer back.","directories":{},"sideEffects":false,"_nodeVersion":"22.22.3","publishConfig":{"access":"public"},"_hasShrinkwrap":false,"_npmOperationalInternal":{"tmp":"tmp/charts_1.0.2_1786466234406_0.15014424331106047","host":"s3://npm-registry-packages-npm-production"}},"1.0.3":{"name":"@arincen/charts","version":"1.0.3","keywords":["chart","charts","canvas","financial","candlestick","trading","stock","ai","agent","llm","accessible"],"author":{"name":"Arincen L.L.C-FZ"},"license":"MIT","_id":"@arincen/charts@1.0.3","maintainers":[{"name":"bahaakhateeb","email":"bahaay@arincen.com"}],"homepage":"https://en.arincen.com/arincen-charts","bugs":{"url":"https://github.com/arincen/arincen-charts/issues"},"dist":{"shasum":"b9e53a0a2765d2dc96a0c6f3cccac8311988a9d8","tarball":"https://registry.npmjs.org/@arincen/charts/-/charts-1.0.3.tgz","fileCount":44,"integrity":"sha512-t1fVaiW0TuqKn41GA327nGGyFejdet9lloOsBFDuYl9ndOTJhQZK93KyNnYORN0/OUc50xN4RUL6xKwCvPVS+g==","signatures":[{"sig":"MEYCIQCkWSblpl8VBWBNdXTKPY2Sf2AEMiCPQrJiwvS0e78bGwIhAJJWaYJp8UHKrWlQkXy9kY4yPwm+9XTyO436A2T2CE0D","keyid":"SHA256:DhQ8wR5APBvFHLF/+Tc+AYvPOdTpcIDqOhxsBHRwC7U"}],"unpackedSize":1655819},"main":"./dist/index.mjs","type":"module","types":"./dist/types/index.d.ts","unpkg":"./dist/arincen-charts.standalone.js","module":"./dist/index.mjs","engines":{"node":">=18"},"exports":{".":{"types":"./dist/types/index.d.ts","import":"./dist/index.mjs","default":"./dist/index.mjs"},"./full":{"types":"./dist/types/full.d.ts","import":"./dist/full.mjs","default":"./dist/full.mjs"},"./standalone":"./dist/arincen-charts.standalone.js","./package.json":"./package.json","./standalone/full":"./dist/arincen-charts-full.standalone.js"},"gitHead":"d3100757a90bbda8784c0d09e736e03ae574a668","_npmUser":{"name":"bahaakhateeb","email":"bahaay@arincen.com"},"jsdelivr":"./dist/arincen-charts.standalone.js","repository":{"url":"git+https://github.com/arincen/arincen-charts.git","type":"git"},"_npmVersion":"10.9.8","description":"A financial chart an AI agent can read: about 22 KB, zero dependencies. Two builds from one codebase, and toText/annotate so a model can describe the chart and draw its answer back.","directories":{},"sideEffects":false,"_nodeVersion":"22.22.3","publishConfig":{"access":"public"},"_hasShrinkwrap":false,"_npmOperationalInternal":{"tmp":"tmp/charts_1.0.3_1786467783172_0.07838437169385282","host":"s3://npm-registry-packages-npm-production"}},"1.1.0":{"name":"@arincen/charts","version":"1.1.0","description":"The charting library an AI agent can read. Lighter, faster, smarter: about 26 KB, zero dependencies. Two builds from one codebase, and toText/annotate so a model can read the chart and draw its answer back.","license":"MIT","author":{"name":"Arincen L.L.C-FZ"},"homepage":"https://en.arincen.com/arincen-charts","repository":{"type":"git","url":"git+https://github.com/arincen/arincen-charts.git"},"bugs":{"url":"https://github.com/arincen/arincen-charts/issues"},"publishConfig":{"access":"public"},"keywords":["chart","charts","canvas","financial","candlestick","trading","stock","ai","agent","llm","accessible"],"type":"module","sideEffects":false,"main":"./dist/index.mjs","module":"./dist/index.mjs","types":"./dist/types/index.d.ts","unpkg":"./dist/arincen-charts.standalone.js","jsdelivr":"./dist/arincen-charts.standalone.js","exports":{".":{"types":"./dist/types/index.d.ts","import":"./dist/index.mjs","default":"./dist/index.mjs"},"./full":{"types":"./dist/types/full.d.ts","import":"./dist/full.mjs","default":"./dist/full.mjs"},"./standalone":"./dist/arincen-charts.standalone.js","./standalone/full":"./dist/arincen-charts-full.standalone.js","./package.json":"./package.json"},"engines":{"node":">=18"},"_id":"@arincen/charts@1.1.0","gitHead":"4d7337344d5011ffeccf6d2bc6bdcc9727c907be","_nodeVersion":"22.22.3","_npmVersion":"10.9.8","dist":{"integrity":"sha512-uG19xj0ExpyjkJ7Iet3V8lfIF+lT4BzwTsfANXs2Fv9pgsnJBdf+qWZJa/l2JnUSnPrT2ZHBPhKVUQ2u9P73AQ==","shasum":"6113d6b55b4a7dad44d00ef98369af8816324d30","tarball":"https://registry.npmjs.org/@arincen/charts/-/charts-1.1.0.tgz","fileCount":46,"unpackedSize":1733073,"signatures":[{"keyid":"SHA256:DhQ8wR5APBvFHLF/+Tc+AYvPOdTpcIDqOhxsBHRwC7U","sig":"MEUCICpPeXR6vqCVQBDchYL4aXPbVrD1zapOV/f6pB4JqBOHAiEAh5ZV4XIXTF4+34tcv6lN4wBfJzqNd9WFjRWVbeX105c="}]},"_npmUser":{"name":"bahaakhateeb","email":"bahaay@arincen.com"},"directories":{},"maintainers":[{"name":"bahaakhateeb","email":"bahaay@arincen.com"}],"_npmOperationalInternal":{"host":"s3://npm-registry-packages-npm-production","tmp":"tmp/charts_1.1.0_1786520109003_0.5934802532763546"},"_hasShrinkwrap":false}},"time":{"created":"2026-08-11T12:15:31.633Z","modified":"2026-08-12T07:35:09.389Z","1.0.0":"2026-08-11T12:15:32.015Z","1.0.1":"2026-08-11T14:08:45.721Z","1.0.2":"2026-08-11T16:37:14.584Z","1.0.3":"2026-08-11T17:03:03.323Z","1.1.0":"2026-08-12T07:35:09.161Z"},"bugs":{"url":"https://github.com/arincen/arincen-charts/issues"},"author":{"name":"Arincen L.L.C-FZ"},"license":"MIT","homepage":"https://en.arincen.com/arincen-charts","keywords":["chart","charts","canvas","financial","candlestick","trading","stock","ai","agent","llm","accessible"],"repository":{"type":"git","url":"git+https://github.com/arincen/arincen-charts.git"},"description":"The charting library an AI agent can read. Lighter, faster, smarter: about 26 KB, zero dependencies. Two builds from one codebase, and toText/annotate so a model can read the chart and draw its answer back.","maintainers":[{"name":"bahaakhateeb","email":"bahaay@arincen.com"}],"readme":"# Arincen Charts\n\n**The charting library an AI agent can read. Lighter, faster, smarter.** A financial chart that draws itself on a canvas, with zero dependencies — and your users can ask it questions, because the agent becomes their eye and hand on it.\n\n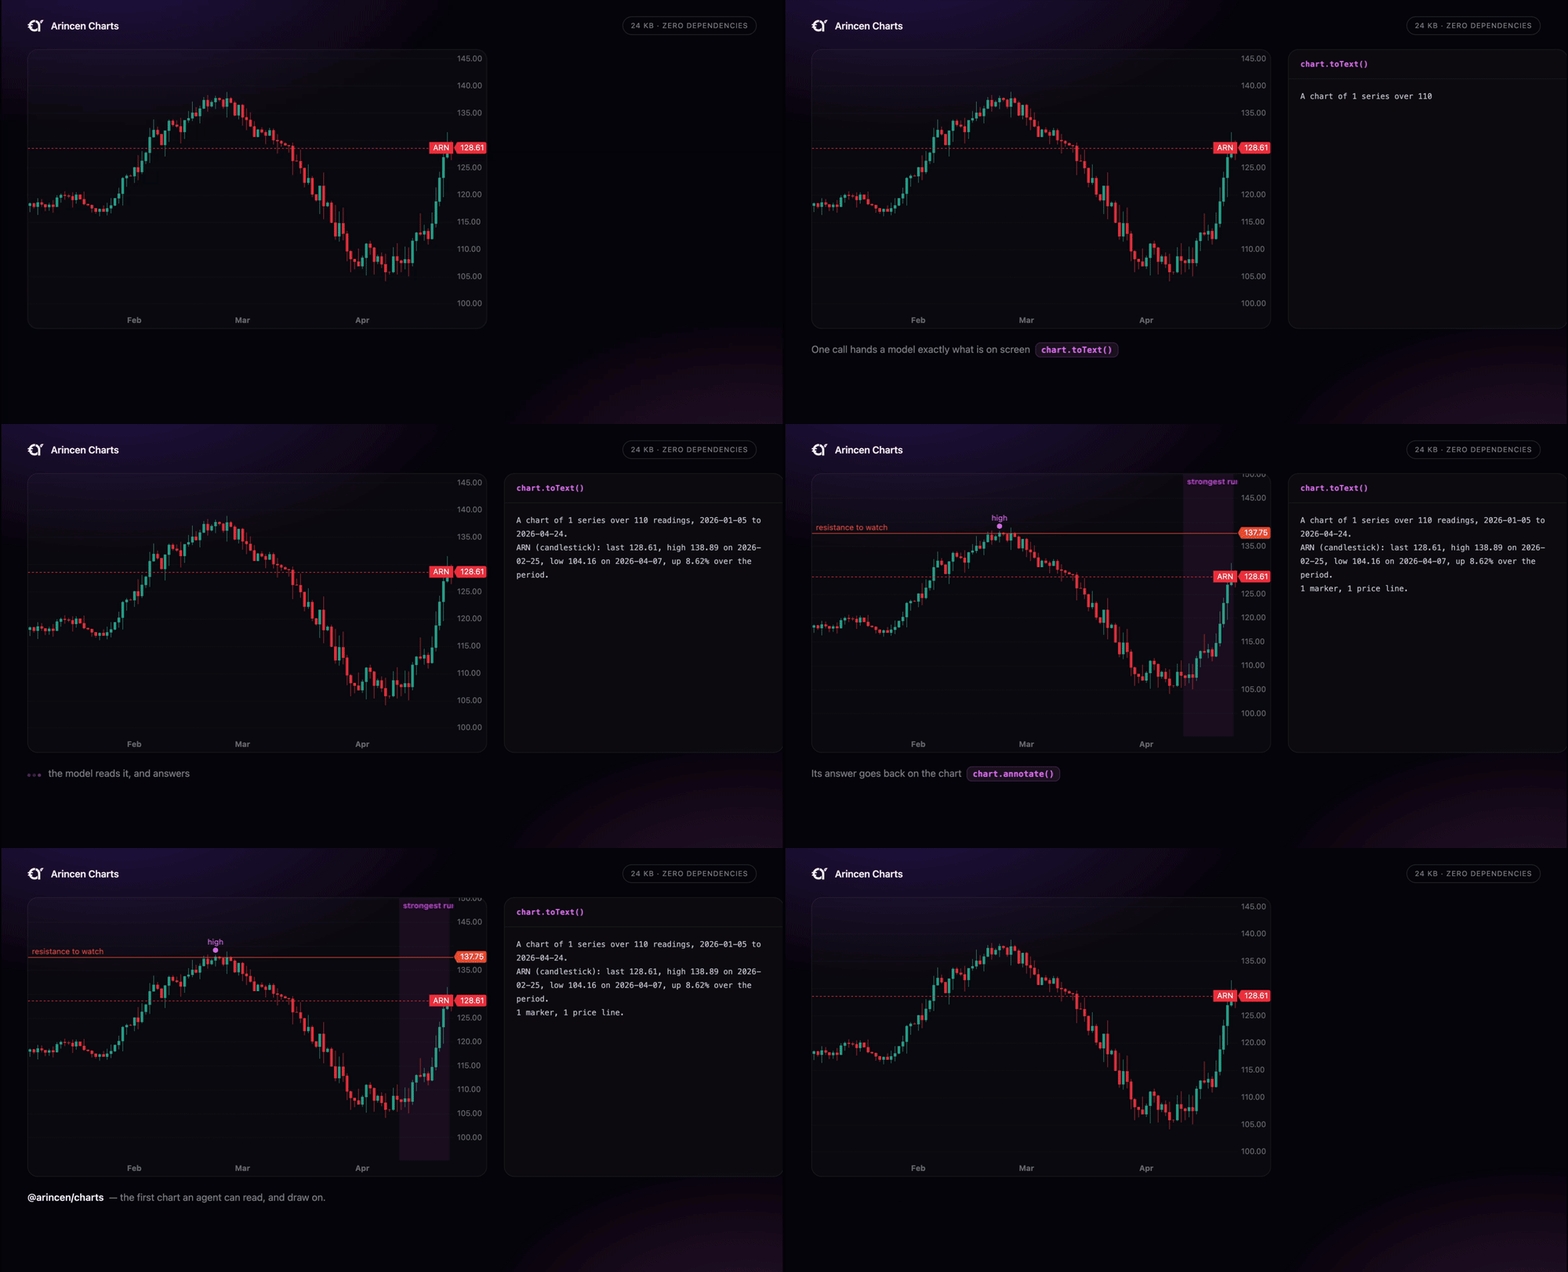\n\n[Documentation](https://docs.arincen.com/charts) · [Overview](https://en.arincen.com/charts)\n\n## The eye and the hand\n\nEvery charting library draws for eyes. Anything else — a language model, a screen reader, an alerting job — has to reach into series internals and write the same summary again in every project.\n\n```js\n// see\nchart.toText(); // what is on screen, in words, deterministic and free of judgement\nchart.toImage(); // the same thing as a PNG, for a vision model\nchart.timeScale().getVisibleRange(); // the period being looked at\n\n// act\nchart.annotate([ // the answer, back on the chart\n { from, to, text }, // a region\n { time, price, text }, // a point\n { price, text }, // a level\n]);\nchart.timeScale().setVisibleRange({ from, to }); // look closer\nchart.setCrosshairPosition(price, time, series); // point at this\n```\n\nNo API key, no bundled model, no provider you are tied to. What is missing everywhere else is the boring half — getting the numbers *out* in a form something can reason about, and getting an answer *back* onto the canvas.\n\nA user who zooms to a spike and asks what happened there has already told you the period. `getVisibleRange()` is the question; `annotate()` is the answer.\n\n[The whole loop, with tool definitions ready to paste](https://docs.arincen.com/charts/agents).\n\n## Getting started\n\n```sh\nnpm install @arincen/charts\n```\n\n```js\nimport { createChart, AreaSeries } from '@arincen/charts';\n\nconst chart = createChart(document.getElementById('chart'), { autoSize: true });\nconst series = chart.addSeries(AreaSeries, { lineColor: '#2962ff', lineWidth: 2 });\n\nseries.setData([\n { time: '2026-01-01', value: 24.1 },\n { time: '2026-01-02', value: 24.8 },\n]);\n\nchart.timeScale().fitContent();\n```\n\nOr from a script tag, with no build step:\n\n```html\n\n\n```\n\n## Two builds from one codebase\n\nThe unusual part. Most of what a charting library carries is structural — panes, non-linear price scales, custom series — and most pages never use any of it. Tree-shaking cannot remove it, because the core genuinely references it and a bundler cannot prove your page has one pane.\n\nSo the split is made at build time:\n\n| | size | has |\n|---|---|---|\n| `@arincen/charts` | ~26 KB | line, area, candlestick, bar, histogram, baseline · crosshair · markers · price lines · primitives · pan/zoom |\n| `@arincen/charts/full` | ~34 KB | all of that, plus panes, logarithmic / percentage / indexed price scales, left and overlay scales, custom series, watermarks, touch tracking, kinetic scroll |\n\n```js\nimport { createChart, AreaSeries } from '@arincen/charts';\n// or, when you need panes or a second price scale:\nimport { createChart, AreaSeries } from '@arincen/charts/full';\n```\n\nNothing changes but the import. The light build simply does not contain the code for what it leaves out — `panes` is not a method that returns empty, it is absent.\n\nBoth figures are gzipped, and both are checked rather than claimed: a test gzips the shipped bundle and fails if it has grown past its budget, or if a number written anywhere in these pages is not the one it measured. There is nothing in `dependencies` to audit.\n\n## Drawing your own things\n\nTwo extension points, both of which take plain objects rather than requiring a subclass:\n\n- **Primitives** decorate a chart that already knows how to draw itself — bands, alert lines, annotations. `series.attachPrimitive(primitive)`.\n- **Custom series** replace the drawing entirely — stacked areas, heatmaps, anything with its own shape. `chart.addCustomSeries(paneView)`, full build only.\n\n## Types\n\nShips `.d.ts` generated from the source, so a misspelled method is a compile error rather than a runtime surprise.\n\n## Time is an index, not a duration\n\nBars are placed by their position in the data, never by elapsed time. That is what collapses weekends, holidays and overnight gaps instead of drawing empty space where a market was shut. It is the right default for market data and the wrong one for a sensor log.\n\n## Attribution\n\nMIT licensed, so this is a request rather than a condition — deliberately. If\nArincen Charts renders something you ship, we would appreciate either keeping\nthe attribution mark it shows by default, or crediting \"Arincen Charts\" near\nthe chart. No particular wording, and no link attribute asked for. Tell us and\nwe will list you among the products built with it.\n\n---\n\nLightweight Charts™ is a trademark of TradingView, Inc. This project is not affiliated with or endorsed by TradingView. Its API is deliberately similar in places, which makes moving across easier; it is not a drop-in replacement and does not aim to be.\n","readmeFilename":"README.md"}