{"_id":"bubble-chart-js","_rev":"24-41a3d690ba9ab26e77c3564fa4b39d14","name":"bubble-chart-js","dist-tags":{"latest":"2.1.3"},"versions":{"1.0.0":{"name":"bubble-chart-js","version":"1.0.0","author":{"name":"Pragadeeshwaran Pasupathi","email":"pragadeeshwaran.pasupathi@gmail.com"},"license":"MIT","_id":"bubble-chart-js@1.0.0","maintainers":[{"name":"pragadeeshwaran-pasupathi","email":"pragadeeshwaran.pasupathi@gmail.com"}],"dist":{"shasum":"c622d7c3995a6c270dec6aaf30936e20e5eb7068","tarball":"https://registry.npmjs.org/bubble-chart-js/-/bubble-chart-js-1.0.0.tgz","fileCount":39,"integrity":"sha512-lm/2brNgcV/nmmbwyM2PCGa5ZgSDZnGM2RBlq0dwY/Xz9ArK7LFzDaeqoWqSv79/Ht6wj/VTRwod9ZLJIUevjg==","signatures":[{"sig":"MEQCIGYJwq/5GyN6nEqVChdr78TXzHhSPYSK1+98SYdoWJ+6AiA0t2QifqlLJiBWTSR3Sidh4JnHL3UpW0GnZBP6+PgyLQ==","keyid":"SHA256:DhQ8wR5APBvFHLF/+Tc+AYvPOdTpcIDqOhxsBHRwC7U"}],"unpackedSize":83963},"main":"dist/index.js","types":"dist/index.d.ts","gitHead":"a71856f31e9be6a88a2e6f3512e9501f6d8e2140","scripts":{"lint":"eslint src/**/*.ts","test":"jest","build":"npm run clean && webpack --mode development","clean":"rimraf dist","start":"webpack serve --open","watch":"webpack --watch","lint:fix":"eslint src/**/*.ts --fix"},"_npmUser":{"name":"pragadeeshwaran-pasupathi","email":"pragadeeshwaran.pasupathi@gmail.com"},"_npmVersion":"10.9.0","description":"bubbleChartJs is a lightweight, customizable JavaScript library for creating stacked bubble charts. It arranges bubbles based on their values, with the largest bubble positioned at the top and surrounding bubbles decreasing in size accordingly.","directories":{},"_nodeVersion":"20.11.0","_hasShrinkwrap":false,"devDependencies":{"jest":"^29.7.0","eslint":"^8.56.0","rimraf":"^6.0.1","ts-jest":"^29.2.6","webpack":"^5.98.0","prettier":"^3.2.4","ts-loader":"^9.5.2","typescript":"^5.7.3","@types/jest":"^29.5.14","webpack-cli":"^6.0.1","webpack-dev-server":"^4.15.1","eslint-config-prettier":"^9.1.0","eslint-plugin-prettier":"^5.1.3","@typescript-eslint/parser":"^7.0.1","@typescript-eslint/eslint-plugin":"^7.0.1"},"_npmOperationalInternal":{"tmp":"tmp/bubble-chart-js_1.0.0_1740749266158_0.6186216973291336","host":"s3://npm-registry-packages-npm-production"}},"1.0.1":{"name":"bubble-chart-js","version":"1.0.1","keywords":["bubble chart","chartjs","chart.js","visualization","data visualization","bubble graph","canvas chart","charts","graph","chart library","chart plugin","data plotting","bubble chartjs"],"author":{"name":"Pragadeeshwaran Pasupathi","email":"pragadeeshwaran.pasupathi@gmail.com"},"license":"MIT","_id":"bubble-chart-js@1.0.1","maintainers":[{"name":"pragadeeshwaran-pasupathi","email":"pragadeeshwaran.pasupathi@gmail.com"}],"dist":{"shasum":"513054284705c5658e65c6591db307e0238781a2","tarball":"https://registry.npmjs.org/bubble-chart-js/-/bubble-chart-js-1.0.1.tgz","fileCount":39,"integrity":"sha512-c3GvPTshKg9OMqwqEhKFH0cxiO4Dq2SrDm/ziG03fty0Ax0FmHg278ganxpEoiNf3TxgFZty2xxLFzXcrYFWkw==","signatures":[{"sig":"MEQCIGGf2TxpCiwnv50UmHG0ORGbf9eeC4XptGslcUfscB20AiAnvxK0rpUAB+3xxXUZXbSK0Nmj0VZzju3MC0MO+pwxFg==","keyid":"SHA256:DhQ8wR5APBvFHLF/+Tc+AYvPOdTpcIDqOhxsBHRwC7U"}],"unpackedSize":84145},"main":"dist/index.js","types":"dist/index.d.ts","gitHead":"a71856f31e9be6a88a2e6f3512e9501f6d8e2140","scripts":{"lint":"eslint src/**/*.ts","test":"jest","build":"npm run clean && webpack --mode development","clean":"rimraf dist","start":"webpack serve --open","watch":"webpack --watch","lint:fix":"eslint src/**/*.ts --fix"},"_npmUser":{"name":"pragadeeshwaran-pasupathi","email":"pragadeeshwaran.pasupathi@gmail.com"},"_npmVersion":"10.9.0","description":"bubbleChartJs is a lightweight, customizable JavaScript library for creating stacked bubble charts. It arranges bubbles based on their values, with the largest bubble positioned at the top and surrounding bubbles decreasing in size accordingly.","directories":{},"_nodeVersion":"20.11.0","_hasShrinkwrap":false,"devDependencies":{"jest":"^29.7.0","eslint":"^8.56.0","rimraf":"^6.0.1","ts-jest":"^29.2.6","webpack":"^5.98.0","prettier":"^3.2.4","ts-loader":"^9.5.2","typescript":"^5.7.3","@types/jest":"^29.5.14","webpack-cli":"^6.0.1","webpack-dev-server":"^4.15.1","eslint-config-prettier":"^9.1.0","eslint-plugin-prettier":"^5.1.3","@typescript-eslint/parser":"^7.0.1","@typescript-eslint/eslint-plugin":"^7.0.1"},"_npmOperationalInternal":{"tmp":"tmp/bubble-chart-js_1.0.1_1740749609037_0.5355205931287885","host":"s3://npm-registry-packages-npm-production"}},"1.0.2":{"name":"bubble-chart-js","version":"1.0.2","keywords":["bubble chart","chartjs","chart.js","visualization","data visualization","bubble graph","canvas chart","charts","graph","chart library","chart plugin","data plotting","bubble chartjs"],"author":{"name":"Pragadeeshwaran Pasupathi","email":"pragadeeshwaran.pasupathi@gmail.com"},"license":"MIT","_id":"bubble-chart-js@1.0.2","maintainers":[{"name":"pragadeeshwaran-pasupathi","email":"pragadeeshwaran.pasupathi@gmail.com"}],"homepage":"https://github.com/Praga-Dev/bubbleChartJS#readme","bugs":{"url":"https://github.com/Praga-Dev/bubbleChartJS/issues"},"dist":{"shasum":"4068114e6d518f639b868e64e816e3ae0808c3e4","tarball":"https://registry.npmjs.org/bubble-chart-js/-/bubble-chart-js-1.0.2.tgz","fileCount":39,"integrity":"sha512-K2mkl6d/V7/n+iPZRiOt2TEJXodowY9pml1lnhm8lFOW+Yky/FUZfTb6SkANjjn6rEde2F5YAMLQ2V1KMUDX7A==","signatures":[{"sig":"MEUCIEEiJLDFr2CpLSRikFgUhRQHRo0V6/tQUpf0fH6Qfj73AiEAoByRCo0eZIzLR73VPHkxZqo8oPD7kBJxOiQV9PBgfxU=","keyid":"SHA256:DhQ8wR5APBvFHLF/+Tc+AYvPOdTpcIDqOhxsBHRwC7U"}],"unpackedSize":84247},"main":"dist/index.js","types":"dist/index.d.ts","gitHead":"a71856f31e9be6a88a2e6f3512e9501f6d8e2140","scripts":{"lint":"eslint src/**/*.ts","test":"jest","build":"npm run clean && webpack --mode development","clean":"rimraf dist","start":"webpack serve --open","watch":"webpack --watch","lint:fix":"eslint src/**/*.ts --fix"},"_npmUser":{"name":"pragadeeshwaran-pasupathi","email":"pragadeeshwaran.pasupathi@gmail.com"},"repository":{"url":"git+https://github.com/Praga-Dev/bubbleChartJS.git","type":"git"},"_npmVersion":"10.9.0","description":"bubbleChartJs is a lightweight, customizable JavaScript library for creating stacked bubble charts. It arranges bubbles based on their values, with the largest bubble positioned at the top and surrounding bubbles decreasing in size accordingly.","directories":{},"_nodeVersion":"20.11.0","_hasShrinkwrap":false,"devDependencies":{"jest":"^29.7.0","eslint":"^8.56.0","rimraf":"^6.0.1","ts-jest":"^29.2.6","webpack":"^5.98.0","prettier":"^3.2.4","ts-loader":"^9.5.2","typescript":"^5.7.3","@types/jest":"^29.5.14","webpack-cli":"^6.0.1","webpack-dev-server":"^4.15.1","eslint-config-prettier":"^9.1.0","eslint-plugin-prettier":"^5.1.3","@typescript-eslint/parser":"^7.0.1","@typescript-eslint/eslint-plugin":"^7.0.1"},"_npmOperationalInternal":{"tmp":"tmp/bubble-chart-js_1.0.2_1740750042826_0.5693459163950254","host":"s3://npm-registry-packages-npm-production"}},"1.0.3":{"name":"bubble-chart-js","version":"1.0.3","keywords":["bubble chart","chartjs","chart.js","visualization","data visualization","bubble graph","canvas chart","charts","graph","chart library","chart plugin","data plotting","bubble chartjs"],"author":{"name":"Pragadeeshwaran Pasupathi","email":"pragadeeshwaran.pasupathi@gmail.com"},"license":"MIT","_id":"bubble-chart-js@1.0.3","maintainers":[{"name":"pragadeeshwaran-pasupathi","email":"pragadeeshwaran.pasupathi@gmail.com"}],"homepage":"https://github.com/Praga-Dev/bubbleChartJS#readme","bugs":{"url":"https://github.com/Praga-Dev/bubbleChartJS/issues"},"dist":{"shasum":"bce41d86a633aeb40c607e31e36f7a1e910f250a","tarball":"https://registry.npmjs.org/bubble-chart-js/-/bubble-chart-js-1.0.3.tgz","fileCount":40,"integrity":"sha512-f7FxNoEoTB4++pLLaK5nm5+zDkWvSrNmsI0ouE3f7+hOtNv0wC7mBkt48KFdlc0LNnGuWMYLv1Ylf56yeD9bfQ==","signatures":[{"sig":"MEMCHySfoMbWvH2ahbAOsd4tIFKYZurmpnIwaBIx3mc5280CIB8AnaPV5OpFwQymn+XD5Hx16Crq7RcbaEkJpGExmoby","keyid":"SHA256:DhQ8wR5APBvFHLF/+Tc+AYvPOdTpcIDqOhxsBHRwC7U"}],"unpackedSize":87367},"main":"dist/index.js","types":"dist/index.d.ts","gitHead":"781b3c5ffdfeb31b79af351d462a15e117876ba7","scripts":{"lint":"eslint src/**/*.ts","test":"jest","build":"npm run clean && webpack --mode development","clean":"rimraf dist","start":"webpack serve --open","watch":"webpack --watch","lint:fix":"eslint src/**/*.ts --fix"},"_npmUser":{"name":"pragadeeshwaran-pasupathi","email":"pragadeeshwaran.pasupathi@gmail.com"},"repository":{"url":"git+https://github.com/Praga-Dev/bubbleChartJS.git","type":"git"},"_npmVersion":"10.9.0","description":"bubbleChartJs is a lightweight, customizable JavaScript library for creating stacked bubble charts. It arranges bubbles based on their values, with the largest bubble positioned at the top and surrounding bubbles decreasing in size accordingly.","directories":{},"_nodeVersion":"20.11.0","_hasShrinkwrap":false,"devDependencies":{"jest":"^29.7.0","eslint":"^8.56.0","rimraf":"^6.0.1","ts-jest":"^29.2.6","webpack":"^5.98.0","prettier":"^3.2.4","ts-loader":"^9.5.2","typescript":"^5.7.3","@types/jest":"^29.5.14","webpack-cli":"^6.0.1","webpack-dev-server":"^4.15.1","eslint-config-prettier":"^9.1.0","eslint-plugin-prettier":"^5.1.3","@typescript-eslint/parser":"^7.0.1","@typescript-eslint/eslint-plugin":"^7.0.1"},"_npmOperationalInternal":{"tmp":"tmp/bubble-chart-js_1.0.3_1740759486359_0.2877119335631939","host":"s3://npm-registry-packages-npm-production"}},"1.0.4":{"name":"bubble-chart-js","version":"1.0.4","keywords":["bubble chart","chartjs","chart.js","visualization","data visualization","bubble graph","canvas chart","charts","graph","chart library","chart plugin","data plotting","bubble chartjs"],"author":{"name":"Pragadeeshwaran Pasupathi","email":"pragadeeshwaran.pasupathi@gmail.com"},"license":"MIT","_id":"bubble-chart-js@1.0.4","maintainers":[{"name":"pragadeeshwaran-pasupathi","email":"pragadeeshwaran.pasupathi@gmail.com"}],"homepage":"https://github.com/Praga-Dev/bubbleChartJS#readme","bugs":{"url":"https://github.com/Praga-Dev/bubbleChartJS/issues"},"dist":{"shasum":"dcc1f0aa203d8ea8fb0d4ae32750e47160d09226","tarball":"https://registry.npmjs.org/bubble-chart-js/-/bubble-chart-js-1.0.4.tgz","fileCount":35,"integrity":"sha512-yaHnbuRzAUbrCYMXm4DaKQRXfI6yM9DJP+52F5x8iM2h18Q09MCk6FlcT8ZLycfr/z61Liwlu0qiLTzLjp7GEA==","signatures":[{"sig":"MEYCIQDLVaibQduZfyUDuV+wZ3cWQGBs2+ys4q8jnUlWsOZ63gIhALxoa5x3ttqTy26NE7Lu/+S4UjojPqtOOix3AEPQw4xo","keyid":"SHA256:DhQ8wR5APBvFHLF/+Tc+AYvPOdTpcIDqOhxsBHRwC7U"}],"unpackedSize":113018},"main":"dist/bubbleChart.cjs.js","types":"dist/index.d.ts","module":"dist/bubbleChart.esm.js","browser":"dist/bubbleChart.umd.js","gitHead":"3f00bfdd633410a64a44c41410735b1d5d21b972","scripts":{"lint":"eslint src/**/*.ts","test":"jest","build":"npm run clean && webpack --mode production","clean":"rimraf dist","start":"webpack serve --open","watch":"webpack --watch","lint:fix":"eslint src/**/*.ts --fix"},"_npmUser":{"name":"pragadeeshwaran-pasupathi","email":"pragadeeshwaran.pasupathi@gmail.com"},"repository":{"url":"git+https://github.com/Praga-Dev/bubbleChartJS.git","type":"git"},"_npmVersion":"10.9.0","description":"bubbleChartJs is a lightweight, customizable JavaScript library for creating stacked bubble charts. It arranges bubbles based on their values, with the largest bubble positioned at the top and surrounding bubbles decreasing in size accordingly.","directories":{},"_nodeVersion":"20.11.0","_hasShrinkwrap":false,"devDependencies":{"jest":"^29.7.0","eslint":"^8.56.0","rimraf":"^6.0.1","ts-jest":"^29.2.6","webpack":"^5.98.0","prettier":"^3.2.4","ts-loader":"^9.5.2","typescript":"^5.7.3","@types/jest":"^29.5.14","webpack-cli":"^6.0.1","webpack-dev-server":"^4.15.1","eslint-config-prettier":"^9.1.0","eslint-plugin-prettier":"^5.1.3","@typescript-eslint/parser":"^7.0.1","@typescript-eslint/eslint-plugin":"^7.0.1"},"_npmOperationalInternal":{"tmp":"tmp/bubble-chart-js_1.0.4_1741059497543_0.0566938628183844","host":"s3://npm-registry-packages-npm-production"}},"1.0.5":{"name":"bubble-chart-js","version":"1.0.5","keywords":["bubble chart","chartjs","chart.js","visualization","data visualization","bubble graph","canvas chart","charts","graph","chart library","chart plugin","data plotting","bubble chartjs"],"author":{"name":"Pragadeeshwaran Pasupathi","email":"pragadeeshwaran.pasupathi@gmail.com"},"license":"MIT","_id":"bubble-chart-js@1.0.5","maintainers":[{"name":"pragadeeshwaran-pasupathi","email":"pragadeeshwaran.pasupathi@gmail.com"}],"homepage":"https://github.com/Praga-Dev/bubbleChartJS#readme","bugs":{"url":"https://github.com/Praga-Dev/bubbleChartJS/issues"},"dist":{"shasum":"8458dcb81e44c53863184e31ee1c65d6554d7867","tarball":"https://registry.npmjs.org/bubble-chart-js/-/bubble-chart-js-1.0.5.tgz","fileCount":35,"integrity":"sha512-gtdOg34oAFrX0LNFYJRvgI+0ZXTVhd7Z53s90+KBA3bvbZGg8FEgNhzbig5eEbqB3xM0gBK9fsDi2Lv0GmOvAg==","signatures":[{"sig":"MEUCICXwMiXdg2BeQGZn4hUI5mjzJV+VROsfKug9rUs6WZZNAiEAvWuiEgXnhUwiTRIV2RMFmJ/mI9cBCVBboi+CzqDzgj0=","keyid":"SHA256:DhQ8wR5APBvFHLF/+Tc+AYvPOdTpcIDqOhxsBHRwC7U"}],"unpackedSize":113067},"main":"dist/bubbleChart.cjs.js","types":"dist/index.d.ts","module":"dist/bubbleChart.esm.js","browser":"dist/bubbleChart.umd.js","gitHead":"81aa75a78c3162896821621e8633bcaec1e580ae","scripts":{"lint":"eslint src/**/*.ts","test":"jest","build":"npm run clean && webpack --mode production","clean":"rimraf dist","start":"webpack serve --open","watch":"webpack --watch","lint:fix":"eslint src/**/*.ts --fix"},"_npmUser":{"name":"pragadeeshwaran-pasupathi","email":"pragadeeshwaran.pasupathi@gmail.com"},"repository":{"url":"git+https://github.com/Praga-Dev/bubbleChartJS.git","type":"git"},"_npmVersion":"10.9.0","description":"bubbleChartJs is a lightweight, customizable JavaScript library for creating stacked bubble charts. It arranges bubbles based on their values, with the largest bubble positioned at the top and surrounding bubbles decreasing in size accordingly.","directories":{},"_nodeVersion":"20.11.0","_hasShrinkwrap":false,"devDependencies":{"jest":"^29.7.0","eslint":"^8.56.0","rimraf":"^6.0.1","ts-jest":"^29.2.6","webpack":"^5.98.0","prettier":"^3.2.4","ts-loader":"^9.5.2","typescript":"^5.7.3","@types/jest":"^29.5.14","webpack-cli":"^6.0.1","webpack-dev-server":"^4.15.1","eslint-config-prettier":"^9.1.0","eslint-plugin-prettier":"^5.1.3","@typescript-eslint/parser":"^7.0.1","@typescript-eslint/eslint-plugin":"^7.0.1"},"_npmOperationalInternal":{"tmp":"tmp/bubble-chart-js_1.0.5_1741060028941_0.8978819811906542","host":"s3://npm-registry-packages-npm-production"}},"1.0.6":{"name":"bubble-chart-js","version":"1.0.6","keywords":["bubble chart","chartjs","chart.js","visualization","data visualization","bubble graph","canvas chart","charts","graph","chart library","chart plugin","data plotting","bubble chartjs"],"author":{"name":"Pragadeeshwaran Pasupathi","email":"pragadeeshwaran.pasupathi@gmail.com"},"license":"MIT","_id":"bubble-chart-js@1.0.6","maintainers":[{"name":"pragadeeshwaran-pasupathi","email":"pragadeeshwaran.pasupathi@gmail.com"}],"homepage":"https://github.com/Praga-Dev/bubbleChartJS#readme","bugs":{"url":"https://github.com/Praga-Dev/bubbleChartJS/issues"},"dist":{"shasum":"6a0ceb189da4983f80d03399e347b9bc1966bbf8","tarball":"https://registry.npmjs.org/bubble-chart-js/-/bubble-chart-js-1.0.6.tgz","fileCount":34,"integrity":"sha512-l5f20KqzuKLM1wiMgNq57XICU0ahZ9XWLgcqAPYnHrgAnkrxLMXH3XM68L0I/2NH5UY+LyJ4OmhdzCV/hZoGfQ==","signatures":[{"sig":"MEQCIAoQwJT4AIjtm9aYYGTTcpfYYfJsfCpVK06sHBzzHBGzAiAyyTdLSep8glyd5W53Z4Pj85YxFWHwGOncZDrEIyDlYA==","keyid":"SHA256:DhQ8wR5APBvFHLF/+Tc+AYvPOdTpcIDqOhxsBHRwC7U"}],"unpackedSize":116630},"main":"dist/bubbleChart.cjs.js","types":"dist/index.d.ts","module":"dist/bubbleChart.esm.js","browser":"dist/bubbleChart.umd.js","gitHead":"eef0e1c7d147a86f399c735612c9a1fef6d048ae","scripts":{"lint":"eslint src/**/*.ts","test":"jest","build":"npm run clean && webpack --mode production","clean":"rimraf dist","start":"webpack serve --open","watch":"webpack --watch","lint:fix":"eslint src/**/*.ts --fix"},"_npmUser":{"name":"pragadeeshwaran-pasupathi","email":"pragadeeshwaran.pasupathi@gmail.com"},"repository":{"url":"git+https://github.com/Praga-Dev/bubbleChartJS.git","type":"git"},"_npmVersion":"10.9.0","description":"bubbleChartJs is a lightweight, customizable JavaScript library for creating stacked bubble charts. It arranges bubbles based on their values, with the largest bubble positioned at the top and surrounding bubbles decreasing in size accordingly.","directories":{},"_nodeVersion":"20.11.0","_hasShrinkwrap":false,"devDependencies":{"jest":"^29.7.0","eslint":"^8.56.0","rimraf":"^6.0.1","ts-jest":"^29.2.6","webpack":"^5.98.0","prettier":"^3.2.4","ts-loader":"^9.5.2","typescript":"^5.7.3","@types/jest":"^29.5.14","webpack-cli":"^6.0.1","webpack-dev-server":"^4.15.1","eslint-config-prettier":"^9.1.0","eslint-plugin-prettier":"^5.1.3","@typescript-eslint/parser":"^7.0.1","@typescript-eslint/eslint-plugin":"^7.0.1"},"_npmOperationalInternal":{"tmp":"tmp/bubble-chart-js_1.0.6_1742927310238_0.9571827997673066","host":"s3://npm-registry-packages-npm-production"}},"1.0.7":{"name":"bubble-chart-js","version":"1.0.7","keywords":["bubble chart","chartjs","chart.js","visualization","data visualization","bubble graph","canvas chart","charts","graph","chart library","chart plugin","data plotting","bubble chartjs"],"author":{"name":"Pragadeeshwaran Pasupathi","email":"pragadeeshwaran.pasupathi@gmail.com"},"license":"MIT","_id":"bubble-chart-js@1.0.7","maintainers":[{"name":"pragadeeshwaran-pasupathi","email":"pragadeeshwaran.pasupathi@gmail.com"}],"homepage":"https://github.com/Praga-Dev/bubbleChartJS#readme","bugs":{"url":"https://github.com/Praga-Dev/bubbleChartJS/issues"},"dist":{"shasum":"ada03a22e6f4c20531fd484130097aef09f1f0ef","tarball":"https://registry.npmjs.org/bubble-chart-js/-/bubble-chart-js-1.0.7.tgz","fileCount":34,"integrity":"sha512-XsGyZlaEL1A5T6GarMm3mlQY/JX1Dz3z64AHILKvk0LfOelrLx9+Gepd/FuzjeFMuJ0arMLvqgvdj78p2SdZWQ==","signatures":[{"sig":"MEYCIQDU/3FDAcrzWyC4+io9o3vWabQsjkf2Y0p2IeGujqB0lQIhANRshV1JAp5qOlhH3uTluFVdb8dSFTikNJs/X9PZf4QD","keyid":"SHA256:DhQ8wR5APBvFHLF/+Tc+AYvPOdTpcIDqOhxsBHRwC7U"}],"unpackedSize":117017},"main":"dist/bubbleChart.cjs.js","types":"dist/index.d.ts","module":"dist/bubbleChart.esm.js","browser":"dist/bubbleChart.umd.js","gitHead":"73da9294c6d3a3bcab64e5935ee58c333f6877aa","scripts":{"lint":"eslint src/**/*.ts","test":"jest","build":"npm run clean && webpack --mode production","clean":"rimraf dist","start":"webpack serve --open","watch":"webpack --watch","lint:fix":"eslint src/**/*.ts --fix"},"_npmUser":{"name":"pragadeeshwaran-pasupathi","email":"pragadeeshwaran.pasupathi@gmail.com"},"repository":{"url":"git+https://github.com/Praga-Dev/bubbleChartJS.git","type":"git"},"_npmVersion":"10.9.0","description":"bubbleChartJs is a lightweight, customizable JavaScript library for creating stacked bubble charts. It arranges bubbles based on their values, with the largest bubble positioned at the top and surrounding bubbles decreasing in size accordingly.","directories":{},"_nodeVersion":"20.11.0","_hasShrinkwrap":false,"devDependencies":{"jest":"^29.7.0","eslint":"^8.56.0","rimraf":"^6.0.1","ts-jest":"^29.2.6","webpack":"^5.98.0","prettier":"^3.2.4","ts-loader":"^9.5.2","typescript":"^5.7.3","@types/jest":"^29.5.14","webpack-cli":"^6.0.1","webpack-dev-server":"^4.15.1","eslint-config-prettier":"^9.1.0","eslint-plugin-prettier":"^5.1.3","@typescript-eslint/parser":"^7.0.1","@typescript-eslint/eslint-plugin":"^7.0.1"},"_npmOperationalInternal":{"tmp":"tmp/bubble-chart-js_1.0.7_1742928934518_0.8496219756094185","host":"s3://npm-registry-packages-npm-production"}},"1.0.8":{"name":"bubble-chart-js","version":"1.0.8","keywords":["bubble chart","chartjs","chart.js","visualization","data visualization","bubble graph","canvas chart","charts","graph","chart library","chart plugin","data plotting","bubble chartjs"],"author":{"name":"Pragadeeshwaran Pasupathi","email":"pragadeeshwaran.pasupathi@gmail.com"},"license":"MIT","_id":"bubble-chart-js@1.0.8","maintainers":[{"name":"pragadeeshwaran-pasupathi","email":"pragadeeshwaran.pasupathi@gmail.com"}],"homepage":"https://github.com/Praga-Dev/bubbleChartJS#readme","bugs":{"url":"https://github.com/Praga-Dev/bubbleChartJS/issues"},"dist":{"shasum":"6817fdd0e0017c71e21d3651673246969f484b6a","tarball":"https://registry.npmjs.org/bubble-chart-js/-/bubble-chart-js-1.0.8.tgz","fileCount":34,"integrity":"sha512-yQ+AabcF7tVmjqGE2ZtlE5qBXzuzNhTCJXfjQ7EJxstui69GJ8DzEQyn+QZpC6o5XFvNsheWSFCE1Ixv+xTdbw==","signatures":[{"sig":"MEQCIEhP03uzdyJaSwAHxzOjZmq0Gz3FzIHa76A7ftFnhLGLAiAoIXtcaZggSz+5clfaVLug2CFqEcbbZ5N34FhvEXUEww==","keyid":"SHA256:DhQ8wR5APBvFHLF/+Tc+AYvPOdTpcIDqOhxsBHRwC7U"}],"unpackedSize":115115},"main":"dist/bubbleChart.cjs.js","types":"dist/index.d.ts","module":"dist/bubbleChart.esm.js","browser":"dist/bubbleChart.umd.js","gitHead":"5282a1001f9e6e25acf45e2d3525eb4dc446a66c","scripts":{"lint":"eslint src/**/*.ts","test":"jest","build":"npm run clean && webpack --mode production","clean":"rimraf dist","start":"webpack serve --open","watch":"webpack --watch","lint:fix":"eslint src/**/*.ts --fix"},"_npmUser":{"name":"pragadeeshwaran-pasupathi","email":"pragadeeshwaran.pasupathi@gmail.com"},"repository":{"url":"git+https://github.com/Praga-Dev/bubbleChartJS.git","type":"git"},"_npmVersion":"10.9.0","description":"bubbleChartJs is a lightweight, customizable JavaScript library for creating stacked bubble charts. It arranges bubbles based on their values, with the largest bubble positioned at the top and surrounding bubbles decreasing in size accordingly.","directories":{},"_nodeVersion":"20.11.0","_hasShrinkwrap":false,"devDependencies":{"jest":"^29.7.0","eslint":"^8.56.0","rimraf":"^6.0.1","ts-jest":"^29.2.6","webpack":"^5.98.0","prettier":"^3.2.4","ts-loader":"^9.5.2","typescript":"^5.7.3","@types/jest":"^29.5.14","webpack-cli":"^6.0.1","webpack-dev-server":"^4.15.1","eslint-config-prettier":"^9.1.0","eslint-plugin-prettier":"^5.1.3","@typescript-eslint/parser":"^7.0.1","@typescript-eslint/eslint-plugin":"^7.0.1"},"_npmOperationalInternal":{"tmp":"tmp/bubble-chart-js_1.0.8_1743005681983_0.0070604534028788635","host":"s3://npm-registry-packages-npm-production"}},"1.0.9":{"name":"bubble-chart-js","version":"1.0.9","keywords":["bubble chart","chartjs","chart.js","visualization","data visualization","bubble graph","canvas chart","charts","graph","chart library","chart plugin","data plotting","bubble chartjs"],"author":{"name":"Pragadeeshwaran Pasupathi","email":"pragadeeshwaran.pasupathi@gmail.com"},"license":"MIT","_id":"bubble-chart-js@1.0.9","maintainers":[{"name":"pragadeeshwaran-pasupathi","email":"pragadeeshwaran.pasupathi@gmail.com"}],"homepage":"https://github.com/Praga-Dev/bubbleChartJS#readme","bugs":{"url":"https://github.com/Praga-Dev/bubbleChartJS/issues"},"dist":{"shasum":"922171a0432cfb06662c91388e997f4f00ac4b58","tarball":"https://registry.npmjs.org/bubble-chart-js/-/bubble-chart-js-1.0.9.tgz","fileCount":34,"integrity":"sha512-FAbtVrKED9lxUZBJEViZpjgB+X16PfCgHv0pu2zo+ImbJuA4Hnqy3YYJbKMlRzydtstnYRlBMxIeKTl36owzdg==","signatures":[{"sig":"MEUCIQCD8TC2vKO+s8KHsBgPoTz/GKn9V3YjitlnKqXMW7qEuQIgcHX1ii6M89f/RKs+y4IPU0Rj8mKcnEw759YPNagkc/0=","keyid":"SHA256:DhQ8wR5APBvFHLF/+Tc+AYvPOdTpcIDqOhxsBHRwC7U"}],"unpackedSize":124920},"main":"dist/bubbleChart.cjs.js","types":"dist/index.d.ts","module":"dist/bubbleChart.esm.js","browser":"dist/bubbleChart.umd.js","gitHead":"706815e3e82518583d7362e783d6dc072ffa459f","scripts":{"lint":"eslint src/**/*.ts","test":"jest","build":"npm run clean && webpack --mode production","clean":"rimraf dist","start":"webpack serve --open","watch":"webpack --watch","lint:fix":"eslint src/**/*.ts --fix"},"_npmUser":{"name":"pragadeeshwaran-pasupathi","email":"pragadeeshwaran.pasupathi@gmail.com"},"repository":{"url":"git+https://github.com/Praga-Dev/bubbleChartJS.git","type":"git"},"_npmVersion":"10.9.0","description":"bubbleChartJs is a lightweight, customizable JavaScript library for creating stacked bubble charts. It arranges bubbles based on their values, with the largest bubble positioned at the top and surrounding bubbles decreasing in size accordingly.","directories":{},"_nodeVersion":"20.11.0","_hasShrinkwrap":false,"devDependencies":{"jest":"^29.7.0","eslint":"^8.56.0","rimraf":"^6.0.1","ts-jest":"^29.2.6","webpack":"^5.98.0","prettier":"^3.2.4","ts-loader":"^9.5.2","typescript":"^5.7.3","@types/jest":"^29.5.14","webpack-cli":"^6.0.1","webpack-dev-server":"^4.15.1","eslint-config-prettier":"^9.1.0","eslint-plugin-prettier":"^5.1.3","@typescript-eslint/parser":"^7.0.1","@typescript-eslint/eslint-plugin":"^7.0.1"},"_npmOperationalInternal":{"tmp":"tmp/bubble-chart-js_1.0.9_1743008443350_0.38702315869686843","host":"s3://npm-registry-packages-npm-production"}},"1.0.10":{"name":"bubble-chart-js","version":"1.0.10","keywords":["bubble chart","chartjs","chart.js","visualization","data visualization","bubble graph","canvas chart","charts","graph","chart library","chart plugin","data plotting","bubble chartjs"],"author":{"name":"Pragadeeshwaran Pasupathi","email":"pragadeeshwaran.pasupathi@gmail.com"},"license":"MIT","_id":"bubble-chart-js@1.0.10","maintainers":[{"name":"pragadeeshwaran-pasupathi","email":"pragadeeshwaran.pasupathi@gmail.com"}],"homepage":"https://github.com/Praga-Dev/bubbleChartJS#readme","bugs":{"url":"https://github.com/Praga-Dev/bubbleChartJS/issues"},"dist":{"shasum":"1ef5a0cb05a6546a4f95228ded3ad1ad5b2d8023","tarball":"https://registry.npmjs.org/bubble-chart-js/-/bubble-chart-js-1.0.10.tgz","fileCount":34,"integrity":"sha512-elSjfQkqnZCT4b6xSG9y02nsVYhntY9XaCTv+pTNy3gTn8hbQxnoSoAuxAs5yDJT9obXlHBe4ljS6BX00Rqk2A==","signatures":[{"sig":"MEQCIEOo6VThXHN8ZB4IUhpmMTrB/uKB7BpJKi0LMt8ISd2pAiApSm2pJa8H0cV9oPyUGXservPpMiBDmJWqS6KDo2YyRQ==","keyid":"SHA256:DhQ8wR5APBvFHLF/+Tc+AYvPOdTpcIDqOhxsBHRwC7U"}],"unpackedSize":135737},"main":"dist/bubbleChart.cjs.js","types":"dist/index.d.ts","module":"dist/bubbleChart.esm.js","browser":"dist/bubbleChart.umd.js","gitHead":"b46429ae2b93d8f0b9bed45899ef93bfe5761759","scripts":{"lint":"eslint src/**/*.ts","test":"jest","build":"npm run clean && webpack --mode production","clean":"rimraf dist","start":"webpack serve --open","watch":"webpack --watch","lint:fix":"eslint src/**/*.ts --fix"},"_npmUser":{"name":"pragadeeshwaran-pasupathi","email":"pragadeeshwaran.pasupathi@gmail.com"},"repository":{"url":"git+https://github.com/Praga-Dev/bubbleChartJS.git","type":"git"},"_npmVersion":"10.9.0","description":"bubbleChartJs is a lightweight, customizable JavaScript library for creating stacked bubble charts. It arranges bubbles based on their values, with the largest bubble positioned at the top and surrounding bubbles decreasing in size accordingly.","directories":{},"_nodeVersion":"20.11.0","_hasShrinkwrap":false,"devDependencies":{"jest":"^29.7.0","eslint":"^8.56.0","rimraf":"^6.0.1","ts-jest":"^29.2.6","webpack":"^5.98.0","prettier":"^3.2.4","ts-loader":"^9.5.2","typescript":"^5.7.3","@types/jest":"^29.5.14","webpack-cli":"^6.0.1","webpack-dev-server":"^4.15.1","eslint-config-prettier":"^9.1.0","eslint-plugin-prettier":"^5.1.3","@typescript-eslint/parser":"^7.0.1","@typescript-eslint/eslint-plugin":"^7.0.1"},"_npmOperationalInternal":{"tmp":"tmp/bubble-chart-js_1.0.10_1743569714215_0.5378958242922074","host":"s3://npm-registry-packages-npm-production"}},"1.0.11":{"name":"bubble-chart-js","version":"1.0.11","keywords":["bubble chart","chartjs","chart.js","visualization","data visualization","bubble graph","canvas chart","charts","graph","chart library","chart plugin","data plotting","bubble chartjs"],"author":{"name":"Pragadeeshwaran Pasupathi","email":"pragadeeshwaran.pasupathi@gmail.com"},"license":"MIT","_id":"bubble-chart-js@1.0.11","maintainers":[{"name":"pragadeeshwaran-pasupathi","email":"pragadeeshwaran.pasupathi@gmail.com"}],"homepage":"https://github.com/Praga-Dev/bubbleChartJS#readme","bugs":{"url":"https://github.com/Praga-Dev/bubbleChartJS/issues"},"dist":{"shasum":"520130b6663b519d2eda0aa3ce4bc20c6fccefaa","tarball":"https://registry.npmjs.org/bubble-chart-js/-/bubble-chart-js-1.0.11.tgz","fileCount":34,"integrity":"sha512-Sbcof6R3EUePE0p8onqBlQEhEjDa17LyBEM2k6jJz/1sSwZ1DjlpcQrEAdzKZrie3G0FO3ujPwrIt3kuyRpWfA==","signatures":[{"sig":"MEUCIEt87Y/zvG4tWd7Ivy8NjXb4KkazkqaxFBjTZ7wF0+HgAiEA9hA4f6KnRy/SA0rkT4SDtpfePM0a49jAE9pOb/M2xho=","keyid":"SHA256:DhQ8wR5APBvFHLF/+Tc+AYvPOdTpcIDqOhxsBHRwC7U"}],"unpackedSize":137083},"main":"dist/bubbleChart.cjs.js","types":"dist/index.d.ts","module":"dist/bubbleChart.esm.js","browser":"dist/bubbleChart.umd.js","gitHead":"2c6c33c207816830ef5de8974c66b522d49c7200","scripts":{"lint":"eslint src/**/*.ts","test":"jest","build":"npm run clean && webpack --mode production","clean":"rimraf dist","start":"webpack serve --open","watch":"webpack --watch","lint:fix":"eslint src/**/*.ts --fix"},"_npmUser":{"name":"pragadeeshwaran-pasupathi","email":"pragadeeshwaran.pasupathi@gmail.com"},"repository":{"url":"git+https://github.com/Praga-Dev/bubbleChartJS.git","type":"git"},"_npmVersion":"10.9.0","description":"bubbleChartJs is a lightweight, customizable JavaScript library for creating stacked bubble charts. It arranges bubbles based on their values, with the largest bubble positioned at the top and surrounding bubbles decreasing in size accordingly.","directories":{},"_nodeVersion":"20.11.0","_hasShrinkwrap":false,"devDependencies":{"jest":"^29.7.0","eslint":"^8.56.0","rimraf":"^6.0.1","ts-jest":"^29.2.6","webpack":"^5.98.0","prettier":"^3.2.4","ts-loader":"^9.5.2","typescript":"^5.7.3","@types/jest":"^29.5.14","webpack-cli":"^6.0.1","webpack-dev-server":"^4.15.1","eslint-config-prettier":"^9.1.0","eslint-plugin-prettier":"^5.1.3","@typescript-eslint/parser":"^7.0.1","@typescript-eslint/eslint-plugin":"^7.0.1"},"_npmOperationalInternal":{"tmp":"tmp/bubble-chart-js_1.0.11_1743578845315_0.4910654421340752","host":"s3://npm-registry-packages-npm-production"}},"1.0.12":{"name":"bubble-chart-js","version":"1.0.12","keywords":["bubble chart","chartjs","chart.js","visualization","data visualization","bubble graph","canvas chart","charts","graph","chart library","chart plugin","data plotting","bubble chartjs"],"author":{"name":"Pragadeeshwaran Pasupathi","email":"pragadeeshwaran.pasupathi@gmail.com"},"license":"MIT","_id":"bubble-chart-js@1.0.12","maintainers":[{"name":"pragadeeshwaran-pasupathi","email":"pragadeeshwaran.pasupathi@gmail.com"}],"homepage":"https://github.com/Praga-Dev/bubbleChartJS#readme","bugs":{"url":"https://github.com/Praga-Dev/bubbleChartJS/issues"},"dist":{"shasum":"78c2a7e8db0f5529850fe86585a6013f2dfc97b5","tarball":"https://registry.npmjs.org/bubble-chart-js/-/bubble-chart-js-1.0.12.tgz","fileCount":34,"integrity":"sha512-oE9gESTTUkTKewio8Tff/uVKQJeceXUPrN/929Q6oc/H2Jj6aaPvkeDOs4+HEXlgOYVHLn5c7dOrWdCeGCqkKg==","signatures":[{"sig":"MEUCIQCqMHC3kcb67eSfpM/lCL5b8+103k1vd6Xoh+KBb8JtxQIgOy0/pP5T3mP+1yjUt8J2F3GEuq2rv6e/LVLlmn5zza4=","keyid":"SHA256:DhQ8wR5APBvFHLF/+Tc+AYvPOdTpcIDqOhxsBHRwC7U"}],"unpackedSize":136654},"main":"dist/bubbleChart.cjs.js","types":"dist/index.d.ts","module":"dist/bubbleChart.esm.js","browser":"dist/bubbleChart.umd.js","gitHead":"8800a7cbd1d72ab628da868a5ae1951fd1929cde","scripts":{"lint":"eslint src/**/*.ts","test":"jest","build":"npm run clean && webpack --mode production","clean":"rimraf dist","start":"webpack serve --open","watch":"webpack --watch","lint:fix":"eslint src/**/*.ts --fix"},"_npmUser":{"name":"pragadeeshwaran-pasupathi","email":"pragadeeshwaran.pasupathi@gmail.com"},"repository":{"url":"git+https://github.com/Praga-Dev/bubbleChartJS.git","type":"git"},"_npmVersion":"10.9.0","description":"bubbleChartJs is a lightweight, customizable JavaScript library for creating stacked bubble charts. It arranges bubbles based on their values, with the largest bubble positioned at the top and surrounding bubbles decreasing in size accordingly.","directories":{},"_nodeVersion":"20.11.0","_hasShrinkwrap":false,"devDependencies":{"jest":"^29.7.0","eslint":"^8.56.0","rimraf":"^6.0.1","ts-jest":"^29.2.6","webpack":"^5.98.0","prettier":"^3.2.4","ts-loader":"^9.5.2","typescript":"^5.7.3","@types/jest":"^29.5.14","webpack-cli":"^6.0.1","webpack-dev-server":"^4.15.1","eslint-config-prettier":"^9.1.0","eslint-plugin-prettier":"^5.1.3","@typescript-eslint/parser":"^7.0.1","@typescript-eslint/eslint-plugin":"^7.0.1"},"_npmOperationalInternal":{"tmp":"tmp/bubble-chart-js_1.0.12_1752577321178_0.9433852996173278","host":"s3://npm-registry-packages-npm-production"}},"1.0.13":{"name":"bubble-chart-js","version":"1.0.13","keywords":["bubble chart","chartjs","chart.js","visualization","data visualization","bubble graph","canvas chart","charts","graph","chart library","chart plugin","data plotting","bubble chartjs"],"author":{"name":"Pragadeeshwaran Pasupathi","email":"pragadeeshwaran.pasupathi@gmail.com"},"license":"MIT","_id":"bubble-chart-js@1.0.13","maintainers":[{"name":"pragadeeshwaran-pasupathi","email":"pragadeeshwaran.pasupathi@gmail.com"}],"homepage":"https://github.com/Praga-Dev/bubbleChartJS#readme","bugs":{"url":"https://github.com/Praga-Dev/bubbleChartJS/issues"},"dist":{"shasum":"e7c0ce3c444622c37904f0f728bfb05c8ab246d9","tarball":"https://registry.npmjs.org/bubble-chart-js/-/bubble-chart-js-1.0.13.tgz","fileCount":34,"integrity":"sha512-+Pc8BoUfd487x1frL5n1joUx8J+j9SDX+VMJsqMQcaI9bp2pZ6Lg6sictjqtDqSwZxvrZPd2Cg4NG42jXfciyw==","signatures":[{"sig":"MEUCIQCAiNQ/RWRNnJNZCsfgLpfwOd29onnZy/PndV1i7pbO6gIgBZBbkoR3d+ru60wM1mKxHtF6XLJvJopqUuMdK+wUCN4=","keyid":"SHA256:DhQ8wR5APBvFHLF/+Tc+AYvPOdTpcIDqOhxsBHRwC7U"}],"unpackedSize":136733},"main":"dist/bubbleChart.cjs.js","types":"dist/index.d.ts","unpkg":"dist/bubbleChart.umd.js","module":"dist/bubbleChart.esm.js","browser":"dist/bubbleChart.umd.js","gitHead":"2ba34d43d77bac59d21f8b51a45754fcaa9a1234","scripts":{"lint":"eslint src/**/*.ts","test":"jest","build":"npm run clean && webpack --mode production","clean":"rimraf dist","start":"webpack serve --open","watch":"webpack --watch","lint:fix":"eslint src/**/*.ts --fix"},"_npmUser":{"name":"pragadeeshwaran-pasupathi","email":"pragadeeshwaran.pasupathi@gmail.com"},"jsdelivr":"dist/bubbleChart.umd.js","repository":{"url":"git+https://github.com/Praga-Dev/bubbleChartJS.git","type":"git"},"_npmVersion":"10.9.0","description":"bubbleChartJs is a lightweight, customizable JavaScript library for creating stacked bubble charts. It arranges bubbles based on their values, with the largest bubble positioned at the top and surrounding bubbles decreasing in size accordingly.","directories":{},"_nodeVersion":"20.11.0","_hasShrinkwrap":false,"devDependencies":{"jest":"^29.7.0","eslint":"^8.56.0","rimraf":"^6.0.1","ts-jest":"^29.2.6","webpack":"^5.98.0","prettier":"^3.2.4","ts-loader":"^9.5.2","typescript":"^5.7.3","@types/jest":"^29.5.14","webpack-cli":"^6.0.1","webpack-dev-server":"^4.15.1","eslint-config-prettier":"^9.1.0","eslint-plugin-prettier":"^5.1.3","@typescript-eslint/parser":"^7.0.1","@typescript-eslint/eslint-plugin":"^7.0.1"},"_npmOperationalInternal":{"tmp":"tmp/bubble-chart-js_1.0.13_1752859854427_0.9441217195537215","host":"s3://npm-registry-packages-npm-production"}},"1.0.15":{"name":"bubble-chart-js","version":"1.0.15","keywords":["bubble chart","chartjs","chart.js","visualization","data visualization","bubble graph","canvas chart","charts","graph","chart library","chart plugin","data plotting","bubble chartjs"],"author":{"name":"Pragadeeshwaran Pasupathi","email":"pragadeeshwaran.pasupathi@gmail.com"},"license":"MIT","_id":"bubble-chart-js@1.0.15","maintainers":[{"name":"pragadeeshwaran-pasupathi","email":"pragadeeshwaran.pasupathi@gmail.com"}],"homepage":"https://github.com/Praga-Dev/bubbleChartJS#readme","bugs":{"url":"https://github.com/Praga-Dev/bubbleChartJS/issues"},"dist":{"shasum":"30af1e9cb38a754c8a178b3dd0b39c13d0a71151","tarball":"https://registry.npmjs.org/bubble-chart-js/-/bubble-chart-js-1.0.15.tgz","fileCount":34,"integrity":"sha512-7dOxAj0IGCGpuHsIW0zLqidIOKsHvG8UDvIMcd4WF7Xt7nBY3ywFQ2HkfIrR2HyGM+s5afEQchT8FuAFaHm8uw==","signatures":[{"sig":"MEUCIQCe6EV77Y0VmYIpM597wpbj/qBsEMAMpv8J6Cg0RKF54AIgTSOfX29mtGX3ute0MRbZUUT1oJGPnZzQk3lzbx0S+Cw=","keyid":"SHA256:DhQ8wR5APBvFHLF/+Tc+AYvPOdTpcIDqOhxsBHRwC7U"}],"unpackedSize":123997},"main":"dist/bubbleChart.cjs.js","types":"dist/index.d.ts","unpkg":"dist/bubbleChart.umd.js","module":"dist/bubbleChart.esm.js","browser":"dist/bubbleChart.umd.js","gitHead":"55d2a10db8d57aa0cdf29ad9ef1d960f1ad7158d","scripts":{"lint":"eslint src/**/*.ts","test":"jest","build":"npm run clean && webpack --mode production","clean":"rimraf dist","start":"webpack serve --open","watch":"webpack --watch","lint:fix":"eslint src/**/*.ts --fix"},"_npmUser":{"name":"pragadeeshwaran-pasupathi","email":"pragadeeshwaran.pasupathi@gmail.com"},"jsdelivr":"dist/bubbleChart.umd.js","repository":{"url":"git+https://github.com/Praga-Dev/bubbleChartJS.git","type":"git"},"_npmVersion":"10.9.0","description":"bubbleChartJs is a lightweight, customizable JavaScript library for creating stacked bubble charts. It arranges bubbles based on their values, with the largest bubble positioned at the top and surrounding bubbles decreasing in size accordingly.","directories":{},"_nodeVersion":"20.11.0","_hasShrinkwrap":false,"devDependencies":{"jest":"^29.7.0","eslint":"^8.56.0","rimraf":"^6.0.1","ts-jest":"^29.2.6","webpack":"^5.98.0","prettier":"^3.2.4","ts-loader":"^9.5.2","typescript":"^5.7.3","@types/jest":"^29.5.14","webpack-cli":"^6.0.1","webpack-dev-server":"^4.15.1","eslint-config-prettier":"^9.1.0","eslint-plugin-prettier":"^5.1.3","@typescript-eslint/parser":"^7.0.1","@typescript-eslint/eslint-plugin":"^7.0.1"},"_npmOperationalInternal":{"tmp":"tmp/bubble-chart-js_1.0.15_1754388999034_0.6897297731731975","host":"s3://npm-registry-packages-npm-production"}},"1.0.17":{"name":"bubble-chart-js","version":"1.0.17","keywords":["bubble chart","chartjs","chart.js","visualization","data visualization","bubble graph","canvas chart","charts","graph","chart library","chart plugin","data plotting","bubble chartjs"],"author":{"name":"Pragadeeshwaran Pasupathi","email":"pragadeeshwaran.pasupathi@gmail.com"},"license":"MIT","_id":"bubble-chart-js@1.0.17","maintainers":[{"name":"pragadeeshwaran-pasupathi","email":"pragadeeshwaran.pasupathi@gmail.com"}],"homepage":"https://github.com/Praga-Dev/bubbleChartJS#readme","bugs":{"url":"https://github.com/Praga-Dev/bubbleChartJS/issues"},"dist":{"shasum":"da855279783863c60a13bd93c8d72050bd94e97d","tarball":"https://registry.npmjs.org/bubble-chart-js/-/bubble-chart-js-1.0.17.tgz","fileCount":34,"integrity":"sha512-7HLTShzDQgaGzQpiIly0D5ZzAKLmOj6EpYukIlGujkThRdwmMJUzrfdl8jq5vkEaUmNxxoXSXitT/RmN6bp+CQ==","signatures":[{"sig":"MEYCIQDlVvOKjA6Boo/bXmXTAxTLlIxVyS1Y2D/LPWssG6ySfgIhAI/6JPkDCae/P6C//FkTj7gYdSTywA7fndI1zAmouuYD","keyid":"SHA256:DhQ8wR5APBvFHLF/+Tc+AYvPOdTpcIDqOhxsBHRwC7U"}],"unpackedSize":124073},"main":"dist/bubbleChart.cjs.js","types":"dist/index.d.ts","unpkg":"dist/bubbleChart.umd.js","module":"dist/bubbleChart.esm.js","browser":"dist/bubbleChart.umd.js","gitHead":"07ae84f13082e9e1701d66b7bdb37bfb11d5ba18","scripts":{"lint":"eslint src/**/*.ts","test":"jest","build":"npm run clean && webpack --mode production","clean":"rimraf dist","start":"webpack serve --open","watch":"webpack --watch","lint:fix":"eslint src/**/*.ts --fix"},"_npmUser":{"name":"pragadeeshwaran-pasupathi","email":"pragadeeshwaran.pasupathi@gmail.com"},"jsdelivr":"dist/bubbleChart.umd.js","repository":{"url":"git+https://github.com/Praga-Dev/bubbleChartJS.git","type":"git"},"_npmVersion":"10.9.0","description":"bubbleChartJs is a lightweight, customizable JavaScript library for creating stacked bubble charts. It arranges bubbles based on their values, with the largest bubble positioned at the top and surrounding bubbles decreasing in size accordingly.","directories":{},"_nodeVersion":"20.11.0","_hasShrinkwrap":false,"devDependencies":{"glob":"^11.1.0","jest":"^29.7.0","eslint":"^8.56.0","rimraf":"^6.0.1","js-yaml":"^3.14.2","ts-jest":"^29.2.6","webpack":"^5.98.0","prettier":"^3.2.4","ts-loader":"^9.5.2","node-forge":"^1.3.2","typescript":"^5.7.3","@types/jest":"^29.5.14","webpack-cli":"^6.0.1","webpack-dev-server":"^5.2.1","eslint-config-prettier":"^9.1.0","eslint-plugin-prettier":"^5.1.3","@typescript-eslint/parser":"^7.0.1","@typescript-eslint/eslint-plugin":"^7.0.1"},"_npmOperationalInternal":{"tmp":"tmp/bubble-chart-js_1.0.17_1767196199637_0.09257434863241265","host":"s3://npm-registry-packages-npm-production"}},"1.0.18":{"name":"bubble-chart-js","version":"1.0.18","keywords":["bubble chart","chartjs","chart.js","visualization","data visualization","bubble graph","canvas chart","charts","graph","chart library","chart plugin","data plotting","bubble chartjs"],"author":{"name":"Pragadeeshwaran Pasupathi","email":"pragadeeshwaran.pasupathi@gmail.com"},"license":"MIT","_id":"bubble-chart-js@1.0.18","maintainers":[{"name":"pragadeeshwaran-pasupathi","email":"pragadeeshwaran.pasupathi@gmail.com"}],"homepage":"https://github.com/Praga-Dev/bubbleChartJS#readme","bugs":{"url":"https://github.com/Praga-Dev/bubbleChartJS/issues"},"dist":{"shasum":"3ab203125f2d0884041b3791e160a2ed398ba8a0","tarball":"https://registry.npmjs.org/bubble-chart-js/-/bubble-chart-js-1.0.18.tgz","fileCount":34,"integrity":"sha512-tsM7upGJOPHqDPrv/L0E9uTNoNt/50quW1wQc7jVwrtzFs7JniLYOWVTt+aGymgpsJ8dN7Huw/ndepSTM6zw3w==","signatures":[{"sig":"MEUCIQDo1t8FFzYoXa2ybNl0mJvVipbrHnKAE2vsSpPrvka5FgIgaCGcNCr3/XZeSW9M1r4CH+G6LeqnMSD0EG54v5tyQHM=","keyid":"SHA256:DhQ8wR5APBvFHLF/+Tc+AYvPOdTpcIDqOhxsBHRwC7U"}],"unpackedSize":124877},"main":"dist/bubbleChart.cjs.js","types":"dist/index.d.ts","unpkg":"dist/bubbleChart.umd.js","module":"dist/bubbleChart.esm.js","browser":"dist/bubbleChart.umd.js","gitHead":"43996f1a923a318ff8a93d5ec68cd9cae5b84b13","scripts":{"lint":"eslint src/**/*.ts","test":"jest","build":"npm run clean && webpack --mode production","clean":"rimraf dist","start":"webpack serve --open","watch":"webpack --watch","lint:fix":"eslint src/**/*.ts --fix"},"_npmUser":{"name":"pragadeeshwaran-pasupathi","email":"pragadeeshwaran.pasupathi@gmail.com"},"jsdelivr":"dist/bubbleChart.umd.js","repository":{"url":"git+https://github.com/Praga-Dev/bubbleChartJS.git","type":"git"},"_npmVersion":"10.9.0","description":"bubbleChartJs is a lightweight, customizable JavaScript library for creating stacked bubble charts. It arranges bubbles based on their values, with the largest bubble positioned at the top and surrounding bubbles decreasing in size accordingly.","directories":{},"_nodeVersion":"20.11.0","_hasShrinkwrap":false,"devDependencies":{"glob":"^11.1.0","jest":"^29.7.0","eslint":"^8.56.0","rimraf":"^6.0.1","js-yaml":"^3.14.2","ts-jest":"^29.2.6","webpack":"^5.98.0","prettier":"^3.2.4","ts-loader":"^9.5.2","node-forge":"^1.3.2","typescript":"^5.7.3","@types/jest":"^29.5.14","webpack-cli":"^6.0.1","webpack-dev-server":"^5.2.1","eslint-config-prettier":"^9.1.0","eslint-plugin-prettier":"^5.1.3","@typescript-eslint/parser":"^7.0.1","@typescript-eslint/eslint-plugin":"^7.0.1"},"_npmOperationalInternal":{"tmp":"tmp/bubble-chart-js_1.0.18_1767199959674_0.4533598284691973","host":"s3://npm-registry-packages-npm-production"}},"1.0.19":{"name":"bubble-chart-js","version":"1.0.19","keywords":["bubble chart","chartjs","chart.js","visualization","data visualization","bubble graph","canvas chart","charts","graph","chart library","chart plugin","data plotting","bubble chartjs"],"author":{"name":"Pragadeeshwaran Pasupathi","email":"pragadeeshwaran.pasupathi@gmail.com"},"license":"MIT","_id":"bubble-chart-js@1.0.19","maintainers":[{"name":"pragadeeshwaran-pasupathi","email":"pragadeeshwaran.pasupathi@gmail.com"}],"homepage":"https://github.com/Praga-Dev/bubbleChartJS#readme","bugs":{"url":"https://github.com/Praga-Dev/bubbleChartJS/issues"},"dist":{"shasum":"b1588e5332828f802f8d20d4da109d310142c0fa","tarball":"https://registry.npmjs.org/bubble-chart-js/-/bubble-chart-js-1.0.19.tgz","fileCount":34,"integrity":"sha512-1BH0CaFBMs25t70MVNs02CL0rCRqzBjaYEqBI10UbRODT7MatXGmuHRb8skMbo+Lex3oguCkp97AP/HknKut+Q==","signatures":[{"sig":"MEYCIQCbkXMTR8EGupiJ6kB0Uc9mdyx8qkaM+aMN/YV9A1g9tQIhAO85X8K2mtwQ9/IwSFbHJBKN97Rq90rvMMOra5/WhgzO","keyid":"SHA256:DhQ8wR5APBvFHLF/+Tc+AYvPOdTpcIDqOhxsBHRwC7U"}],"unpackedSize":123401},"main":"dist/bubbleChart.cjs.js","types":"dist/index.d.ts","unpkg":"dist/bubbleChart.umd.js","module":"dist/bubbleChart.esm.js","browser":"dist/bubbleChart.umd.js","gitHead":"7536bfe7e952ad14d45cd66cf1fefc2ddcea3903","scripts":{"lint":"eslint src/**/*.ts","test":"jest","build":"npm run clean && webpack --mode production","clean":"rimraf dist","start":"webpack serve --open","watch":"webpack --watch","lint:fix":"eslint src/**/*.ts --fix"},"_npmUser":{"name":"pragadeeshwaran-pasupathi","email":"pragadeeshwaran.pasupathi@gmail.com"},"jsdelivr":"dist/bubbleChart.umd.js","repository":{"url":"git+https://github.com/Praga-Dev/bubbleChartJS.git","type":"git"},"_npmVersion":"10.9.0","description":"bubbleChartJs is a lightweight, customizable JavaScript library for creating stacked bubble charts. It arranges bubbles based on their values, with the largest bubble positioned at the top and surrounding bubbles decreasing in size accordingly.","directories":{},"_nodeVersion":"20.11.0","_hasShrinkwrap":false,"devDependencies":{"glob":"^11.1.0","jest":"^29.7.0","eslint":"^8.56.0","rimraf":"^6.0.1","js-yaml":"^3.14.2","ts-jest":"^29.2.6","webpack":"^5.98.0","prettier":"^3.2.4","ts-loader":"^9.5.2","node-forge":"^1.3.2","typescript":"^5.7.3","@types/jest":"^29.5.14","webpack-cli":"^6.0.1","webpack-dev-server":"^5.2.1","eslint-config-prettier":"^9.1.0","eslint-plugin-prettier":"^5.1.3","@typescript-eslint/parser":"^7.0.1","@typescript-eslint/eslint-plugin":"^7.0.1"},"_npmOperationalInternal":{"tmp":"tmp/bubble-chart-js_1.0.19_1767200558927_0.03105348264448371","host":"s3://npm-registry-packages-npm-production"}},"1.1.0":{"name":"bubble-chart-js","version":"1.1.0","keywords":["bubble","chart","bubble chart","bubble chart js","chartjs","chart.js","visualization","data visualization","bubble graph","canvas chart","charts","graph","chart library","chart plugin","data plotting","bubble chartjs"],"author":{"name":"Pragadeeshwaran Pasupathi","email":"pragadeeshwaran.pasupathi@gmail.com"},"license":"MIT","_id":"bubble-chart-js@1.1.0","maintainers":[{"name":"pragadeeshwaran-pasupathi","email":"pragadeeshwaran.pasupathi@gmail.com"}],"homepage":"https://github.com/Praga-Dev/bubbleChartJS#readme","bugs":{"url":"https://github.com/Praga-Dev/bubbleChartJS/issues"},"dist":{"shasum":"c03afaf86a9b5222a8d05b1f39d67ba79d28e3e0","tarball":"https://registry.npmjs.org/bubble-chart-js/-/bubble-chart-js-1.1.0.tgz","fileCount":21,"integrity":"sha512-r5WnfMTMoMSsXZTw7JuN0uosCdYfPZCck6WnajgjrQMBKIMo4Enut/02uTWbk3NGSB0Mx7xsqFeFYdQPwEZljA==","signatures":[{"sig":"MEYCIQDfin4eOo7DRji7EiXMV06cZ5qrhIFbPpfStwixnNG7XAIhAJkk41iaLZB7n8JNb+i+OU3rTUIMaaE9YrBFdzaq/4jF","keyid":"SHA256:DhQ8wR5APBvFHLF/+Tc+AYvPOdTpcIDqOhxsBHRwC7U"}],"unpackedSize":128311},"main":"dist/bubbleChart.cjs.js","types":"dist/index.d.ts","unpkg":"dist/bubbleChart.umd.js","module":"dist/bubbleChart.esm.js","browser":"dist/bubbleChart.umd.js","gitHead":"7f16bc9cf14e2f87a352f10a81bd8a397af5237b","scripts":{"lint":"eslint src/**/*.ts","test":"jest","build":"npm run clean && webpack --mode production","clean":"rimraf dist","start":"webpack serve --open","watch":"webpack --watch","lint:fix":"eslint src/**/*.ts --fix"},"_npmUser":{"name":"pragadeeshwaran-pasupathi","email":"pragadeeshwaran.pasupathi@gmail.com"},"jsdelivr":"dist/bubbleChart.umd.js","repository":{"url":"git+https://github.com/Praga-Dev/bubbleChartJS.git","type":"git"},"_npmVersion":"10.9.0","description":"bubbleChartJs is a lightweight, customizable JavaScript library for creating stacked bubble charts. It arranges bubbles based on their values, with the largest bubble positioned at the top and surrounding bubbles decreasing in size accordingly.","directories":{},"_nodeVersion":"20.11.0","_hasShrinkwrap":false,"devDependencies":{"glob":"^11.1.0","jest":"^29.7.0","eslint":"^8.56.0","rimraf":"^6.0.1","js-yaml":"^3.14.2","ts-jest":"^29.2.6","webpack":"^5.98.0","prettier":"^3.2.4","ts-loader":"^9.5.2","node-forge":"^1.3.2","typescript":"^5.7.3","@types/jest":"^29.5.14","webpack-cli":"^6.0.1","webpack-dev-server":"^5.2.1","eslint-config-prettier":"^9.1.0","eslint-plugin-prettier":"^5.1.3","@typescript-eslint/parser":"^7.0.1","@typescript-eslint/eslint-plugin":"^7.0.1"},"_npmOperationalInternal":{"tmp":"tmp/bubble-chart-js_1.1.0_1774028712861_0.37515203446203205","host":"s3://npm-registry-packages-npm-production"}},"2.0.0":{"name":"bubble-chart-js","version":"2.0.0","keywords":["bubble","chart","bubble chart","bubble chart js","chartjs","chart.js","visualization","data visualization","bubble graph","canvas chart","charts","graph","chart library","chart plugin","data plotting","bubble chartjs"],"author":{"name":"Pragadeeshwaran Pasupathi","email":"pragadeeshwaran.pasupathi@gmail.com"},"license":"MIT","_id":"bubble-chart-js@2.0.0","maintainers":[{"name":"pragadeeshwaran-pasupathi","email":"pragadeeshwaran.pasupathi@gmail.com"}],"homepage":"https://github.com/praga-dev/bubble-chart-js#readme","bugs":{"url":"https://github.com/praga-dev/bubble-chart-js/issues"},"dist":{"shasum":"46b1560194a4c453fb420c1456725ed0094b6768","tarball":"https://registry.npmjs.org/bubble-chart-js/-/bubble-chart-js-2.0.0.tgz","fileCount":45,"integrity":"sha512-xnT/2vFwcToQ5nEs2cGktkgDq3KbX/JBccRiV5iXZmyh/CH6axjI8Yt9TdQvJS3/WODfEv0VerEhHy/RRejgNA==","signatures":[{"sig":"MEYCIQCKU+yZKIz3HZNJ73nRy7A/ppmHQQXxuCOzQ75xnXM4IAIhALL/eHaZShbPVmE/A1cj8iyUYjZs0V5ryUWzdZtrtZ2Q","keyid":"SHA256:DhQ8wR5APBvFHLF/+Tc+AYvPOdTpcIDqOhxsBHRwC7U"}],"unpackedSize":534315},"main":"dist/bubbleChart.cjs.js","types":"dist/index.d.ts","unpkg":"dist/bubbleChart.umd.js","module":"dist/bubbleChart.esm.js","browser":"dist/bubbleChart.umd.js","gitHead":"5aa9f0d294571c0d235fcb313f39d1ed9182ac67","scripts":{"demo":"webpack serve --config-name demo","lint":"eslint src/**/*.ts","test":"jest","build":"npm run clean && webpack --mode production","clean":"rimraf dist","start":"webpack serve --config-name demo","watch":"webpack --watch","lint:fix":"eslint src/**/*.ts --fix"},"_npmUser":{"name":"pragadeeshwaran-pasupathi","email":"pragadeeshwaran.pasupathi@gmail.com"},"jsdelivr":"dist/bubbleChart.umd.js","repository":{"url":"git+https://github.com/praga-dev/bubble-chart-js.git","type":"git"},"_npmVersion":"10.9.0","description":"bubbleChartJs is a lightweight, customizable JavaScript library for creating stacked bubble charts. It arranges bubbles based on their values, with the largest bubble positioned at the top and surrounding bubbles decreasing in size accordingly.","directories":{},"_nodeVersion":"20.11.0","_hasShrinkwrap":false,"devDependencies":{"glob":"^11.1.0","jest":"^29.7.0","eslint":"^8.56.0","rimraf":"^6.0.1","js-yaml":"^3.14.2","ts-jest":"^29.2.6","webpack":"^5.98.0","prettier":"^3.2.4","ts-loader":"^9.5.2","node-forge":"^1.3.2","typescript":"^5.7.3","@types/jest":"^29.5.14","webpack-cli":"^6.0.1","webpack-dev-server":"^5.2.1","eslint-config-prettier":"^9.1.0","eslint-plugin-prettier":"^5.1.3","@typescript-eslint/parser":"^7.0.1","@typescript-eslint/eslint-plugin":"^7.0.1"},"_npmOperationalInternal":{"tmp":"tmp/bubble-chart-js_2.0.0_1774125270783_0.746847049867607","host":"s3://npm-registry-packages-npm-production"}},"2.1.0":{"name":"bubble-chart-js","version":"2.1.0","keywords":["bubble","chart","bubblechart","bubble chart","bubble-chart","bubble chart js","packed bubble chart","packed bubble graph","stacked bubble chart","stacked bubble graph","chartjs","visualization","data visualization","bubble graph","canvas chart","charts","graph","chart library","chart plugin","data plotting","bubble chartjs"],"author":{"name":"Pragadeeshwaran Pasupathi","email":"pragadeeshwaran.pasupathi@gmail.com"},"license":"MIT","_id":"bubble-chart-js@2.1.0","maintainers":[{"name":"pragadeeshwaran-pasupathi","email":"pragadeeshwaran.pasupathi@gmail.com"}],"homepage":"https://github.com/praga-dev/bubble-chart-js#readme","bugs":{"url":"https://github.com/praga-dev/bubble-chart-js/issues"},"dist":{"shasum":"9e7e7d26d8404e428a05065a7d1490412653e979","tarball":"https://registry.npmjs.org/bubble-chart-js/-/bubble-chart-js-2.1.0.tgz","fileCount":60,"integrity":"sha512-ZX7307nhVrRlZDmVOB79EP59a3DL92RUsx9x3TebUNNUiw5REDkhT48qClf11DETgUTqDrCutX61enOokTG2FQ==","signatures":[{"sig":"MEQCIHOmO990iybQMWz8O6HjV3yH/+A3dOlBrgV1Y3Pv7NbdAiAnHIaHodz3+Jb7uA4YcSDvDFl16Rh41zYGyiaNOBK7bg==","keyid":"SHA256:DhQ8wR5APBvFHLF/+Tc+AYvPOdTpcIDqOhxsBHRwC7U"}],"unpackedSize":2311576},"main":"dist/bubbleChart.cjs.js","types":"dist/index.d.ts","unpkg":"dist/bubbleChart.umd.js","module":"dist/bubbleChart.esm.js","browser":"dist/bubbleChart.umd.js","gitHead":"e7c1728378040117df4e5b678a21ffee3ac625ab","scripts":{"demo":"webpack serve --config-name demo","lint":"eslint src/**/*.ts","test":"jest","build":"npm run clean && webpack --mode production","clean":"rimraf dist","start":"webpack serve --config-name demo","watch":"webpack --watch","lint:fix":"eslint src/**/*.ts --fix"},"_npmUser":{"name":"pragadeeshwaran-pasupathi","email":"pragadeeshwaran.pasupathi@gmail.com"},"jsdelivr":"dist/bubbleChart.umd.js","repository":{"url":"git+https://github.com/praga-dev/bubble-chart-js.git","type":"git"},"_npmVersion":"10.9.0","description":"bubbleChartJs is a lightweight, customizable JavaScript library for creating stacked bubble charts. It arranges bubbles based on their values, with the largest bubble positioned at the top and surrounding bubbles decreasing in size accordingly.","directories":{},"_nodeVersion":"20.11.0","_hasShrinkwrap":false,"devDependencies":{"glob":"^11.1.0","jest":"^29.7.0","eslint":"^8.56.0","rimraf":"^6.0.1","js-yaml":"^3.14.2","ts-jest":"^29.2.6","webpack":"^5.98.0","prettier":"^3.2.4","ts-loader":"^9.5.2","node-forge":"^1.3.2","typescript":"^5.7.3","@types/jest":"^29.5.14","webpack-cli":"^6.0.1","webpack-dev-server":"^5.2.1","eslint-config-prettier":"^9.1.0","eslint-plugin-prettier":"^5.1.3","@typescript-eslint/parser":"^7.0.1","@typescript-eslint/eslint-plugin":"^7.0.1"},"_npmOperationalInternal":{"tmp":"tmp/bubble-chart-js_2.1.0_1774599210563_0.727849300246382","host":"s3://npm-registry-packages-npm-production"}},"2.1.1":{"name":"bubble-chart-js","version":"2.1.1","keywords":["bubble","chart","bubblechart","bubble chart","bubble-chart","bubble chart js","packed bubble chart","packed bubble graph","stacked bubble chart","stacked bubble graph","chartjs","visualization","data visualization","bubble graph","canvas chart","charts","graph","chart library","chart plugin","data plotting","bubble chartjs"],"author":{"name":"Pragadeeshwaran Pasupathi","email":"pragadeeshwaran.pasupathi@gmail.com"},"license":"MIT","_id":"bubble-chart-js@2.1.1","maintainers":[{"name":"pragadeeshwaran-pasupathi","email":"pragadeeshwaran.pasupathi@gmail.com"}],"homepage":"https://github.com/praga-dev/bubble-chart-js#readme","bugs":{"url":"https://github.com/praga-dev/bubble-chart-js/issues"},"dist":{"shasum":"7e5707fcdee4aa90061cbe5be9d4ec9ec1293428","tarball":"https://registry.npmjs.org/bubble-chart-js/-/bubble-chart-js-2.1.1.tgz","fileCount":60,"integrity":"sha512-MMK1HBG/nKf1/gkHU7I654y2IrGKv27XBLHdz4Z0waDtJw/Kf7F77cBD3UrrSJ+g/mI+9Qcj7QZC2gNupuaEdg==","signatures":[{"sig":"MEUCIQDs/+44przTBgf0T+wp+QCQ9n+MiqANtiyELHlpW3MJmAIgLpfr7DKB2oSfBlZrTBELjRwo6Yfw+1mz3uOr3uEEhY0=","keyid":"SHA256:DhQ8wR5APBvFHLF/+Tc+AYvPOdTpcIDqOhxsBHRwC7U"}],"unpackedSize":2370624},"main":"dist/bubbleChart.cjs.js","types":"dist/index.d.ts","unpkg":"dist/bubbleChart.umd.js","module":"dist/bubbleChart.esm.js","browser":"dist/bubbleChart.umd.js","gitHead":"53b60bac02312711bce0278e1265176bddf3fe72","scripts":{"demo":"webpack serve --config-name demo","lint":"eslint src/**/*.ts","test":"jest","build":"npm run clean && webpack --mode production","clean":"rimraf dist","start":"webpack serve --config-name demo","watch":"webpack --watch","lint:fix":"eslint src/**/*.ts --fix"},"_npmUser":{"name":"pragadeeshwaran-pasupathi","email":"pragadeeshwaran.pasupathi@gmail.com"},"jsdelivr":"dist/bubbleChart.umd.js","repository":{"url":"git+https://github.com/praga-dev/bubble-chart-js.git","type":"git"},"_npmVersion":"10.9.0","description":"bubbleChartJs is a lightweight, customizable JavaScript library for creating stacked bubble charts. It arranges bubbles based on their values, with the largest bubble positioned at the top and surrounding bubbles decreasing in size accordingly.","directories":{},"_nodeVersion":"20.11.0","_hasShrinkwrap":false,"devDependencies":{"glob":"^11.1.0","jest":"^29.7.0","eslint":"^8.56.0","rimraf":"^6.0.1","js-yaml":"^3.14.2","ts-jest":"^29.2.6","webpack":"^5.98.0","prettier":"^3.2.4","ts-loader":"^9.5.2","node-forge":"^1.3.2","typescript":"^5.7.3","@types/jest":"^29.5.14","webpack-cli":"^6.0.1","webpack-dev-server":"^5.2.1","eslint-config-prettier":"^9.1.0","eslint-plugin-prettier":"^5.1.3","@typescript-eslint/parser":"^7.0.1","@typescript-eslint/eslint-plugin":"^7.0.1"},"_npmOperationalInternal":{"tmp":"tmp/bubble-chart-js_2.1.1_1774600084135_0.9931467354009154","host":"s3://npm-registry-packages-npm-production"}},"2.1.2":{"name":"bubble-chart-js","version":"2.1.2","keywords":["bubble","chart","bubblechart","bubble chart","bubble-chart","bubble chart js","packed bubble chart","packed bubble graph","stacked bubble chart","stacked bubble graph","chartjs","visualization","data visualization","bubble graph","canvas chart","charts","graph","chart library","chart plugin","data plotting","bubble chartjs"],"author":{"name":"Pragadeeshwaran Pasupathi","email":"pragadeeshwaran.pasupathi@gmail.com"},"license":"MIT","_id":"bubble-chart-js@2.1.2","maintainers":[{"name":"pragadeeshwaran-pasupathi","email":"pragadeeshwaran.pasupathi@gmail.com"}],"homepage":"https://praga-dev.github.io/bubble-chart-js/","bugs":{"url":"https://github.com/praga-dev/bubble-chart-js/issues"},"dist":{"shasum":"754758044ef7c78bb7ffdcf298e8dc87260b895b","tarball":"https://registry.npmjs.org/bubble-chart-js/-/bubble-chart-js-2.1.2.tgz","fileCount":60,"integrity":"sha512-2t6geOpyBa4Lrycwis68ydVwabqjj5Bp9k3HqBpMgzm0zpRxQboojlCw0VnaJ9+beBlVvEFGemuBNNrxxoQlQw==","signatures":[{"sig":"MEQCIChzXpa9GpU1Fw6oEhCRwVINUwQ57mTRqb0ozeBpzYSPAiBiJFUbYDirKeuRLzirXy0QotwVQWnUCSGIaerjQLm3lg==","keyid":"SHA256:DhQ8wR5APBvFHLF/+Tc+AYvPOdTpcIDqOhxsBHRwC7U"}],"unpackedSize":2370987},"main":"dist/bubbleChart.cjs.js","types":"dist/index.d.ts","unpkg":"dist/bubbleChart.umd.js","module":"dist/bubbleChart.esm.js","browser":"dist/bubbleChart.umd.js","gitHead":"e72069d9d29918f31fc417720d9e46ea85c08aaa","scripts":{"demo":"webpack serve --config-name demo","lint":"eslint src/**/*.ts","test":"jest","build":"npm run clean && webpack --mode production","clean":"rimraf dist","start":"webpack serve --config-name demo","watch":"webpack --watch","lint:fix":"eslint src/**/*.ts --fix"},"_npmUser":{"name":"pragadeeshwaran-pasupathi","email":"pragadeeshwaran.pasupathi@gmail.com"},"jsdelivr":"dist/bubbleChart.umd.js","repository":{"url":"git+https://github.com/praga-dev/bubble-chart-js.git","type":"git"},"_npmVersion":"10.9.0","description":"bubbleChartJs is a lightweight, customizable JavaScript library for creating stacked bubble charts. It arranges bubbles based on their values, with the largest bubble positioned at the top and surrounding bubbles decreasing in size accordingly.","directories":{},"_nodeVersion":"20.11.0","_hasShrinkwrap":false,"devDependencies":{"glob":"^11.1.0","jest":"^29.7.0","eslint":"^8.56.0","rimraf":"^6.0.1","js-yaml":"^3.14.2","ts-jest":"^29.2.6","webpack":"^5.98.0","prettier":"^3.2.4","ts-loader":"^9.5.2","node-forge":"^1.3.2","typescript":"^5.7.3","@types/jest":"^29.5.14","webpack-cli":"^6.0.1","webpack-dev-server":"^5.2.1","eslint-config-prettier":"^9.1.0","eslint-plugin-prettier":"^5.1.3","@typescript-eslint/parser":"^7.0.1","@typescript-eslint/eslint-plugin":"^7.0.1"},"_npmOperationalInternal":{"tmp":"tmp/bubble-chart-js_2.1.2_1774600784498_0.941343333559491","host":"s3://npm-registry-packages-npm-production"}},"2.1.3":{"name":"bubble-chart-js","version":"2.1.3","description":"bubbleChartJs is a lightweight, customizable JavaScript library for creating stacked bubble charts. It arranges bubbles based on their values, with the largest bubble positioned at the top and surrounding bubbles decreasing in size accordingly.","main":"dist/bubbleChart.cjs.js","module":"dist/bubbleChart.esm.js","browser":"dist/bubbleChart.umd.js","unpkg":"dist/bubbleChart.umd.js","jsdelivr":"dist/bubbleChart.umd.js","types":"dist/index.d.ts","scripts":{"clean":"rimraf dist","build":"npm run clean && webpack --mode production","watch":"webpack --watch","start":"webpack serve --config-name demo","demo":"webpack serve --config-name demo","lint":"eslint src/**/*.ts","lint:fix":"eslint src/**/*.ts --fix","test":"jest"},"devDependencies":{"@types/jest":"^29.5.14","@typescript-eslint/eslint-plugin":"^7.0.1","@typescript-eslint/parser":"^7.0.1","eslint":"^8.56.0","eslint-config-prettier":"^9.1.0","eslint-plugin-prettier":"^5.1.3","glob":"^11.1.0","jest":"^29.7.0","js-yaml":"^3.14.2","node-forge":"^1.3.2","prettier":"^3.2.4","rimraf":"^6.0.1","ts-jest":"^29.2.6","ts-loader":"^9.5.2","typescript":"^5.7.3","webpack":"^5.98.0","webpack-cli":"^6.0.1","webpack-dev-server":"^5.2.1"},"homepage":"https://praga-dev.github.io/bubble-chart-js/","author":{"name":"Pragadeeshwaran Pasupathi","email":"pragadeeshwaran.pasupathi@gmail.com"},"repository":{"type":"git","url":"git+https://github.com/praga-dev/bubble-chart-js.git"},"license":"MIT","keywords":["bubble","chart","bubblechart","bubble chart","bubble-chart","bubble chart js","packed bubble chart","packed bubble graph","stacked bubble chart","stacked bubble graph","chartjs","visualization","data visualization","bubble graph","canvas chart","charts","graph","chart library","chart plugin","data plotting","bubble chartjs"],"_id":"bubble-chart-js@2.1.3","gitHead":"95d07c571871a8ac41ffd3e9d32247c66ab7c447","bugs":{"url":"https://github.com/praga-dev/bubble-chart-js/issues"},"_nodeVersion":"20.11.0","_npmVersion":"10.9.0","dist":{"integrity":"sha512-G88+kxKfEigYQepd4T3/KLFGXDMjl9lZDj6C+NrPLth3RC4RS4koZR/XblExzYcfieTL+EGO1TzVHKA6kuWAVw==","shasum":"da1a4c180475306341eac3a480b5195c2d3282c4","tarball":"https://registry.npmjs.org/bubble-chart-js/-/bubble-chart-js-2.1.3.tgz","fileCount":37,"unpackedSize":173943,"signatures":[{"keyid":"SHA256:DhQ8wR5APBvFHLF/+Tc+AYvPOdTpcIDqOhxsBHRwC7U","sig":"MEQCIHfRTHUsc+yPVNnGDZtVWRELOsLGyyZBidqPO8QeozDyAiAzrkf6cr5IW5hVsSISxDbLIjgpBd/6i9g3HlIsijieiw=="}]},"_npmUser":{"name":"pragadeeshwaran-pasupathi","email":"pragadeeshwaran.pasupathi@gmail.com"},"directories":{},"maintainers":[{"name":"pragadeeshwaran-pasupathi","email":"pragadeeshwaran.pasupathi@gmail.com"}],"_npmOperationalInternal":{"host":"s3://npm-registry-packages-npm-production","tmp":"tmp/bubble-chart-js_2.1.3_1774950203315_0.9297122424707336"},"_hasShrinkwrap":false}},"time":{"created":"2025-02-28T13:27:46.157Z","modified":"2026-03-31T09:43:23.596Z","1.0.0":"2025-02-28T13:27:46.430Z","1.0.1":"2025-02-28T13:33:29.268Z","1.0.2":"2025-02-28T13:40:43.007Z","1.0.3":"2025-02-28T16:18:06.548Z","1.0.4":"2025-03-04T03:38:17.713Z","1.0.5":"2025-03-04T03:47:09.128Z","1.0.6":"2025-03-25T18:28:30.433Z","1.0.7":"2025-03-25T18:55:34.740Z","1.0.8":"2025-03-26T16:14:42.208Z","1.0.9":"2025-03-26T17:00:43.678Z","1.0.10":"2025-04-02T04:55:14.456Z","1.0.11":"2025-04-02T07:27:25.513Z","1.0.12":"2025-07-15T11:02:01.420Z","1.0.13":"2025-07-18T17:30:54.608Z","1.0.15":"2025-08-05T10:16:39.232Z","1.0.17":"2025-12-31T15:49:59.801Z","1.0.18":"2025-12-31T16:52:39.830Z","1.0.19":"2025-12-31T17:02:39.068Z","1.1.0":"2026-03-20T17:45:13.049Z","2.0.0":"2026-03-21T20:34:30.982Z","2.1.0":"2026-03-27T08:13:30.826Z","2.1.1":"2026-03-27T08:28:04.389Z","2.1.2":"2026-03-27T08:39:44.710Z","2.1.3":"2026-03-31T09:43:23.475Z"},"bugs":{"url":"https://github.com/praga-dev/bubble-chart-js/issues"},"author":{"name":"Pragadeeshwaran Pasupathi","email":"pragadeeshwaran.pasupathi@gmail.com"},"license":"MIT","homepage":"https://praga-dev.github.io/bubble-chart-js/","keywords":["bubble","chart","bubblechart","bubble chart","bubble-chart","bubble chart js","packed bubble chart","packed bubble graph","stacked bubble chart","stacked bubble graph","chartjs","visualization","data visualization","bubble graph","canvas chart","charts","graph","chart library","chart plugin","data plotting","bubble chartjs"],"repository":{"type":"git","url":"git+https://github.com/praga-dev/bubble-chart-js.git"},"description":"bubbleChartJs is a lightweight, customizable JavaScript library for creating stacked bubble charts. It arranges bubbles based on their values, with the largest bubble positioned at the top and surrounding bubbles decreasing in size accordingly.","maintainers":[{"name":"pragadeeshwaran-pasupathi","email":"pragadeeshwaran.pasupathi@gmail.com"}],"readme":"# bubble-chart-js\n\n**A high-performance, fully configurable Bubble Chart library for high-density analytics dashboards.**\n\nZero dependencies. Framework-agnostic. Ships as ESM, CJS, and UMD.\n\n[](https://www.npmjs.com/package/bubble-chart-js)\n[](https://www.npmjs.com/package/bubble-chart-js)\n[](https://opensource.org/licenses/MIT)\n\n---\n\n## Demo\n\n\n\n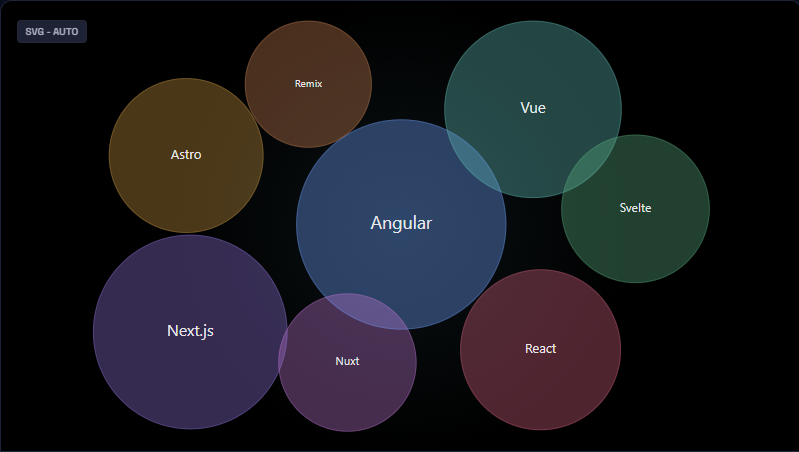\n\n**[View the Live Interactive Demo →](https://praga-dev.github.io/bubble-chart-js/)**\n\n---\n\n## Features\n\n- **Dual renderer** — auto-selects Canvas (large datasets) or SVG (small datasets); override with `render.mode`\n- **Physics & static layouts** — force-directed physics simulation with fully tunable parameters, or instant static placement\n- **Glass & flat themes** — built-in visual themes with GPU-accelerated bloom and glow effects\n- **Per-bubble customization** — individual color, opacity, label, icon, and font overrides per data item\n- **Live updates** — call `chart.update(newData)` for smooth, reconciled transitions without re-initializing\n- **Pluggable layer hooks** — inject custom draw calls into any render layer (`background`, `bubbles`, `text`, `overlay`, …)\n- **Event system** — subscribe to `bubble:click`, `bubble:hover`, and more with a clean pub/sub API\n- **Angular-ready** — ships full TypeScript types; integrates seamlessly into Angular, React, Vue, or vanilla JS\n- **Tiny footprint** — zero runtime dependencies; tree-shakeable ESM build\n\n---\n\n## Installation\n\n```bash\nnpm install bubble-chart-js\n```\n\n### CDN (no build step)\n\n```html\n\n```\n\n---\n\n## Quick Start\n\n### Vanilla JavaScript / TypeScript\n\n```html\n\n\n```\n\n```ts\nimport { initializeChart } from \"bubble-chart-js\";\n\nconst chart = initializeChart({\n canvasContainerId: \"chart\",\n data: [\n { id: \"chrome\", label: \"Chrome\", value: 65, bubbleColor: \"#4285F4\" },\n { id: \"safari\", label: \"Safari\", value: 19, bubbleColor: \"#34A853\" },\n { id: \"firefox\", label: \"Firefox\", value: 10, bubbleColor: \"#FF6D00\" },\n { id: \"edge\", label: \"Edge\", value: 6, bubbleColor: \"#0078D4\" },\n ],\n layout: { type: \"physics\" },\n render: { mode: \"auto\", theme: \"glass\" },\n});\n\n// React to bubble clicks\nchart.on(\"bubble:click\", ({ item }) => console.log(\"Clicked:\", item.label));\n\n// Push new data — smooth animated transition\nchart.update(newData);\n\n// Teardown (stops animation loop, removes DOM elements)\nchart.destroy();\n```\n\n### Angular\n\n```ts\n// chart.component.ts\nimport { Component, OnDestroy, AfterViewInit } from \"@angular/core\";\nimport { initializeChart, BubbleChart } from \"bubble-chart-js\";\n\n@Component({\n selector: \"app-chart\",\n template: ``,\n})\nexport class ChartComponent implements AfterViewInit, OnDestroy {\n private chart!: BubbleChart;\n\n ngAfterViewInit(): void {\n this.chart = initializeChart({\n canvasContainerId: \"bubble-chart\",\n data: [\n { id: \"revenue\", label: \"Revenue\", value: 840, bubbleColor: \"#6366f1\" },\n { id: \"churn\", label: \"Churn\", value: 230, bubbleColor: \"#f43f5e\" },\n { id: \"nps\", label: \"NPS\", value: 510, bubbleColor: \"#10b981\" },\n ],\n layout: { type: \"physics\" },\n render: { theme: \"glass\" },\n });\n }\n\n ngOnDestroy(): void {\n this.chart.destroy();\n }\n}\n```\n\n### Browser Script Tag (UMD)\n\n```html\n\n\n\n```\n\n---\n\n## API Reference\n\n### `initializeChart(config)`\n\nCreates and renders the chart. Returns a `BubbleChart` instance.\n\n```ts\nimport { initializeChart } from \"bubble-chart-js\";\nconst chart = initializeChart(config);\n```\n\n### `BubbleChart` Instance Methods\n\n| Method | Signature | Description |\n| ----------------- | ----------------------------------- | ---------------------------------------------------------- |\n| `update` | `(newData: DataItem[]) => void` | Re-render with new data; animates transitions |\n| `on` | `(event, handler) => UnsubscribeFn` | Subscribe to chart events (`bubble:click`, `bubble:hover`) |\n| `destroy` | `() => void` | Stop animation, remove DOM nodes, clear all subscriptions |\n| `addLayerHook` | `(hook) => string` | Inject a custom draw call into a named render layer |\n| `removeLayerHook` | `(id: string) => void` | Remove a layer hook by ID |\n| `simulation` | `Readonly` | Snapshot of the last physics simulation tick |\n\n### `topN(data, n)` Utility\n\nSelects the top N items by value — useful for capping high-cardinality datasets before render.\n\n```ts\nimport { initializeChart, topN } from \"bubble-chart-js\";\n\ninitializeChart({ canvasContainerId: \"chart\", data: topN(rawData, 25) });\n```\n\n---\n\n## Configuration Reference\n\n### `DataItem`\n\n| Property | Type | Required | Description |\n| ------------- | -------- | -------- | --------------------------------------------------------------------- |\n| `id` | `string` | No | Stable key for reconciliation on `update()`. Auto-derived if omitted. |\n| `label` | `string` | **Yes** | Text displayed inside the bubble |\n| `value` | `number` | **Yes** | Determines bubble radius relative to the dataset |\n| `bubbleColor` | `string` | No | CSS color string for this specific bubble |\n| `opacity` | `number` | No | Fill opacity `0–1`. Overrides global `bubbleAppearance.opacity` |\n| `icon` | `string` | No | Unicode codepoint or ligature string (e.g. `\"trending_up\"`) |\n| `iconFont` | `string` | No | Font family for the icon, e.g. `\"Material Symbols Outlined\"` |\n\n### `Configuration` (top-level)\n\n| Property | Type | Default | Description |\n| ---------------------------------- | ------------------- | ------------- | ------------------------------------------------------------------ |\n| `canvasContainerId` | `string` | — | **Required.** ID of the host DOM element |\n| `data` | `DataItem[]` | — | **Required.** Array of bubble data |\n| `colorPalette` | `string[]` | built-in | Fallback color cycle for bubbles without an explicit `bubbleColor` |\n| `minRadius` | `number` | `20` | Minimum bubble radius in pixels |\n| `canvasBackgroundColor` | `string` | `transparent` | Canvas background fill color |\n| `isResizeCanvasOnWindowSizeChange` | `boolean` | `true` | Auto-resize chart on window resize |\n| `theme` | `\"flat\" \\| \"glass\"` | `\"flat\"` | Shorthand alias for `render.theme` |\n\n### `layout`\n\n| Property | Type | Default | Description |\n| ------------------------ | ------------------------- | ----------- | ---------------------------------------------------------- |\n| `type` | `\"static\" \\| \"physics\"` | `\"static\"` | Layout engine selection |\n| `physics.seed` | `number` | — | Seed for deterministic initial bubble placement |\n| `physics.centerStrength` | `number` | `0.012` | Strength of the centering force |\n| `physics.collisionPad` | `number` | `3` | Extra padding (px) added to each bubble's collision radius |\n| `physics.velocityDecay` | `number` | `0.82` | Velocity decay per tick (`0–1`) |\n| `physics.alphaDecay` | `number` | `0.0228` | Alpha decay rate per tick |\n| `physics.maxVelocity` | `number` | `8` | Maximum velocity magnitude per tick |\n| `physics.updateBehavior` | `\"restart\" \\| \"momentum\"` | `\"restart\"` | How `update()` affects a running simulation |\n\n### `render`\n\n| Property | Type | Default | Description |\n| ---------------------------- | ----------------------------- | -------- | ----------------------------------------------------------- |\n| `mode` | `\"auto\" \\| \"svg\" \\| \"canvas\"` | `\"auto\"` | Renderer selection (`auto` picks Canvas for >25 items) |\n| `theme` | `\"flat\" \\| \"glass\"` | `\"flat\"` | Visual theme |\n| `glassPerformanceHint` | `\"safe\" \\| \"full\"` | `\"safe\"` | `full` = GPU feGaussianBlur bloom; `safe` = CSS drop-shadow |\n| `glassOptions.glowIntensity` | `number` | `0.35` | Glow intensity `0–1` (glass theme only) |\n| `glassOptions.blurRadius` | `number` | `12` | Outer halo blur radius in px (`full` mode only) |\n\n### `interaction`\n\n| Property | Type | Default | Description |\n| ---------------- | --------- | ------- | ------------------------------------------ |\n| `hoverScale` | `number` | `1.08` | Scale factor applied to the hovered bubble |\n| `hoverEase` | `number` | `0.10` | Lerp factor for hover animation (`0–1`) |\n| `tooltipEnabled` | `boolean` | `true` | Show tooltip on hover |\n\n### `animation`\n\n| Property | Type | Default | Description |\n| ------------------ | ----------------------- | ------- | ------------------------------------------------- |\n| `entryDuration` | `number` | `25` | Entry animation duration in frames |\n| `transitionEasing` | `(t: number) => number` | — | Custom easing function for position/radius tweens |\n\n### Tooltip (`tooltipOptions`)\n\nFull CSS-style control over the hover tooltip. Accepts `backgroundColor`, `fontColor`, `fontFamily`, `fontSize`, `padding`, `borderColor`, `boxShadow`, `zIndex`, and more. Supply a `formatter` function for fully custom HTML content:\n\n```ts\ntooltipOptions: {\n backgroundColor: '#1e1e2e',\n fontColor: '#cdd6f4',\n formatter: (item) => `${item.label}: ${item.value.toLocaleString()}`,\n},\n```\n\n---\n\n## Events\n\n| Event | Payload | Description |\n| -------------- | ------------------------------------------------- | ------------------------------ |\n| `bubble:click` | `{ item: DataItem, event: PointerEvent }` | Fired when a bubble is clicked |\n| `bubble:hover` | `{ item: DataItem \\| null, event: PointerEvent }` | Fired on hover enter / leave |\n\n```ts\nconst unsub = chart.on(\"bubble:click\", ({ item }) => {\n console.log(`${item.label}: ${item.value}`);\n});\n\n// Stop listening\nunsub();\n```\n\n---\n\n## Layer Hooks\n\nInject custom Canvas 2D draw calls into any render layer for complete visual control:\n\n```ts\nchart.addLayerHook({\n layer: \"overlay\",\n draw: ({ ctx, bubbles }) => {\n bubbles.forEach((b) => {\n ctx.strokeStyle = \"rgba(255,255,255,0.4)\";\n ctx.lineWidth = 2;\n ctx.beginPath();\n ctx.arc(b.x, b.y, b.r + 4, 0, Math.PI * 2);\n ctx.stroke();\n });\n },\n});\n```\n\nAvailable layers: `background`, `shadows`, `bubbles`, `text`, `overlay`, `debug`.\n\n---\n\n## Contributing\n\nContributions, bug reports, and feature requests are welcome. Please open an issue or submit a pull request on [GitHub](https://github.com/praga-dev/bubble-chart-js).\n\n---\n\n## License\n\nMIT © [Pragadeeshwaran Pasupathi](https://github.com/praga-dev)\n","readmeFilename":"README.md"}