{"_id":"locuszoom","_rev":"51-e8d5a16cccf5a1648c4eb4cd509b6a2f","name":"locuszoom","description":"Generate interactive visualizations of statistical genetic data","dist-tags":{"latest":"0.14.0","beta":"0.14.0-beta.4"},"versions":{"0.4.7":{"name":"locuszoom","version":"0.4.7","description":"Generate interactive visualizations of statistical genetic data","keywords":["visualization","genetics","genes","gwas","phewas"],"homepage":"http://locuszoom.org","license":"MIT","author":{"name":"Christopher Clark","email":"chriclrk@umich.edu"},"main":"locuszoom.app.js","repository":{"type":"git","url":"git+https://github.com/statgen/locuszoom.git"},"scripts":{"test":"gulp test"},"dependencies":{"q":"~1.4.0","d3":"~3.5.0"},"devDependencies":{"gulp":"~3.9.0","gulp-util":"~3.0.0","gulp-watch":"~4.3.0","gulp-concat":"~2.6.0","gulp-uglify":"~1.5.0","gulp-mocha":"~2.2.0","gulp-sass":"~2.1.1","gulp-wrap":"~0.11.0","yargs":"~3.32.0","mocha":"~2.3.0","should":"~8.0.0","jsdom":"~7.2.0","mocha-jsdom":"~1.0.0"},"gitHead":"9a016440ea265fc5dffd669a216f01b879519d61","bugs":{"url":"https://github.com/statgen/locuszoom/issues"},"_id":"locuszoom@0.4.7","_shasum":"cf9351971a5800960fb3a92f43a2215fc70040f6","_from":".","_npmVersion":"2.14.7","_nodeVersion":"4.2.3","_npmUser":{"name":"frencil","email":"frencils@gmail.com"},"dist":{"shasum":"cf9351971a5800960fb3a92f43a2215fc70040f6","tarball":"https://registry.npmjs.org/locuszoom/-/locuszoom-0.4.7.tgz","integrity":"sha512-uVTjW9hjGLmPVsyo3tZtu0ncSwZAHZDg5hmFQ+RN7WZ/Jx3fXzhLMY/OscHY+qtaTpCNez6Ah8CaobtPnqniWA==","signatures":[{"keyid":"SHA256:jl3bwswu80PjjokCgh0o2w5c2U4LhQAE57gj9cz1kzA","sig":"MEUCIH1K+HPjXs5Royj2+fpsU4mWi8/NwmI+pkgIFA0diNcvAiEA4PU1eYnXbZuAliNCcQfPvBWcdLIlWdVnQ4EEgkNkbTc="}]},"maintainers":[{"name":"frencil","email":"frencils@gmail.com"}],"_npmOperationalInternal":{"host":"packages-12-west.internal.npmjs.com","tmp":"tmp/locuszoom-0.4.7.tgz_1478556182469_0.7878650887869298"},"directories":{}},"0.4.8":{"name":"locuszoom","version":"0.4.8","description":"Generate interactive visualizations of statistical genetic data","keywords":["visualization","genetics","genes","gwas","phewas"],"homepage":"http://locuszoom.org","license":"MIT","author":{"name":"Christopher Clark","email":"chriclrk@umich.edu"},"main":"locuszoom.app.js","repository":{"type":"git","url":"git+https://github.com/statgen/locuszoom.git"},"scripts":{"test":"gulp test"},"dependencies":{"q":"~1.4.0","d3":"~3.5.0"},"devDependencies":{"gulp":"~3.9.0","gulp-util":"~3.0.0","gulp-watch":"~4.3.0","gulp-concat":"~2.6.0","gulp-uglify":"~1.5.0","gulp-mocha":"~2.2.0","gulp-sass":"~2.1.1","gulp-wrap":"~0.11.0","yargs":"~3.32.0","mocha":"~2.3.0","should":"~8.0.0","jsdom":"~7.2.0","mocha-jsdom":"~1.0.0"},"gitHead":"517006ffbd05446d72eb069bba79d6f7b1f11836","bugs":{"url":"https://github.com/statgen/locuszoom/issues"},"_id":"locuszoom@0.4.8","_shasum":"278e396eecaed85908c4f46f1d680f347b16bc8d","_from":".","_npmVersion":"2.14.7","_nodeVersion":"4.2.3","_npmUser":{"name":"frencil","email":"frencils@gmail.com"},"dist":{"shasum":"278e396eecaed85908c4f46f1d680f347b16bc8d","tarball":"https://registry.npmjs.org/locuszoom/-/locuszoom-0.4.8.tgz","integrity":"sha512-nAdbdqsDMjzJjHnQf6o5bQu5GV188ubD/2uY2TJ/0M0pozjMtei+HXuNTP6NUqUkrTOPiZCNhwbK/+yifJ80GA==","signatures":[{"keyid":"SHA256:jl3bwswu80PjjokCgh0o2w5c2U4LhQAE57gj9cz1kzA","sig":"MEQCIDnUX/tn1ZCDE217Er+uo+ZdKoSOhBbg5i0bSGNFzLTfAiAFAT/32uLV/VESwZC31PBO/RQShR2XiSadUJAnpjUILA=="}]},"maintainers":[{"name":"frencil","email":"frencils@gmail.com"}],"_npmOperationalInternal":{"host":"packages-18-east.internal.npmjs.com","tmp":"tmp/locuszoom-0.4.8.tgz_1478791918009_0.6888895381707698"},"directories":{}},"0.5.0":{"name":"locuszoom","version":"0.5.0","description":"Generate interactive visualizations of statistical genetic data","keywords":["visualization","genetics","genes","gwas","phewas"],"homepage":"http://locuszoom.org","license":"MIT","author":{"name":"Christopher Clark","email":"chriclrk@umich.edu"},"main":"locuszoom.app.js","repository":{"type":"git","url":"git+https://github.com/statgen/locuszoom.git"},"scripts":{"test":"gulp test"},"dependencies":{"q":"~1.4.0","d3":"~3.5.0"},"devDependencies":{"gulp":"~3.9.0","gulp-util":"~3.0.0","gulp-watch":"~4.3.0","gulp-concat":"~2.6.0","gulp-uglify":"~1.5.0","gulp-mocha":"~2.2.0","gulp-sass":"~2.1.1","gulp-wrap":"~0.11.0","yargs":"~3.32.0","mocha":"~2.3.0","should":"~8.0.0","jsdom":"~7.2.0","mocha-jsdom":"~1.0.0"},"gitHead":"a50b2fa5547b490e30b7fbd83b98d9d3dce2ad2a","bugs":{"url":"https://github.com/statgen/locuszoom/issues"},"_id":"locuszoom@0.5.0","_shasum":"8e3a82e46f80e2b75ead0f762c82f7a4ffd40697","_from":".","_npmVersion":"3.5.1","_nodeVersion":"5.0.0-pre","_npmUser":{"name":"frencil","email":"frencils@gmail.com"},"dist":{"shasum":"8e3a82e46f80e2b75ead0f762c82f7a4ffd40697","tarball":"https://registry.npmjs.org/locuszoom/-/locuszoom-0.5.0.tgz","integrity":"sha512-nGUlEUl0qL3JQgdrlpsdcuUwhfHseM/sZFvmstBU37GHlz5kl1QL3vTMNfRMNVxCGt5e+MlwZgHIXIrpT4qlaA==","signatures":[{"keyid":"SHA256:jl3bwswu80PjjokCgh0o2w5c2U4LhQAE57gj9cz1kzA","sig":"MEQCIGGv5cAYaQfTBOmBpkEIZAwBAg4FpuO0p65uaJY25ukhAiAlzpcH/lB1xlL6jC7HaDBDoRx/oK9S5+88KaR/IwmlDg=="}]},"maintainers":[{"name":"frencil","email":"frencils@gmail.com"}],"_npmOperationalInternal":{"host":"packages-18-east.internal.npmjs.com","tmp":"tmp/locuszoom-0.5.0.tgz_1479924231161_0.6480818772688508"},"directories":{}},"0.5.1":{"name":"locuszoom","version":"0.5.1","description":"Generate interactive visualizations of statistical genetic data","keywords":["visualization","genetics","genes","gwas","phewas"],"homepage":"http://locuszoom.org","license":"MIT","author":{"name":"Christopher Clark","email":"chriclrk@umich.edu"},"main":"locuszoom.app.js","repository":{"type":"git","url":"git+https://github.com/statgen/locuszoom.git"},"scripts":{"test":"gulp test"},"dependencies":{"q":"~1.4.0","d3":"~3.5.0"},"devDependencies":{"gulp":"~3.9.0","gulp-util":"~3.0.0","gulp-watch":"~4.3.0","gulp-concat":"~2.6.0","gulp-uglify":"~1.5.0","gulp-mocha":"~2.2.0","gulp-sass":"~2.1.1","gulp-wrap":"~0.11.0","yargs":"~3.32.0","mocha":"~2.3.0","should":"~8.0.0","jsdom":"~7.2.0","mocha-jsdom":"~1.0.0"},"gitHead":"d2e725c7b8e6fdda6cf42835f7d94443ecc4b67b","bugs":{"url":"https://github.com/statgen/locuszoom/issues"},"_id":"locuszoom@0.5.1","_shasum":"13985092b3c10931ab5ec24583336da366342f79","_from":".","_npmVersion":"2.14.7","_nodeVersion":"4.2.3","_npmUser":{"name":"frencil","email":"frencils@gmail.com"},"dist":{"shasum":"13985092b3c10931ab5ec24583336da366342f79","tarball":"https://registry.npmjs.org/locuszoom/-/locuszoom-0.5.1.tgz","integrity":"sha512-M/jD99nTp5BTGMUEeE6xMAS5dFAyg3130BoBnv/8i67z4oo/YKc4Sc4k48ptfIOY+nPcPbFG5TUqPriX91mwgg==","signatures":[{"keyid":"SHA256:jl3bwswu80PjjokCgh0o2w5c2U4LhQAE57gj9cz1kzA","sig":"MEQCIADhNOt5lAlwgeSZVQnMC/zs0TpIe1Gf1yqq0nITHgLUAiAfogDO+h6Goivb+Sv80EH3MPKFE6EzL0xK9YrChOkX6w=="}]},"maintainers":[{"name":"frencil","email":"frencils@gmail.com"}],"_npmOperationalInternal":{"host":"packages-12-west.internal.npmjs.com","tmp":"tmp/locuszoom-0.5.1.tgz_1481316565787_0.3914229474030435"},"directories":{}},"0.5.2":{"name":"locuszoom","version":"0.5.2","description":"Generate interactive visualizations of statistical genetic data","keywords":["visualization","genetics","genes","gwas","phewas"],"homepage":"http://locuszoom.org","license":"MIT","author":{"name":"Christopher Clark","email":"chriclrk@umich.edu"},"main":"locuszoom.app.js","repository":{"type":"git","url":"git+https://github.com/statgen/locuszoom.git"},"scripts":{"test":"gulp test"},"dependencies":{"q":"~1.4.0","d3":"~3.5.0"},"devDependencies":{"gulp":"~3.9.0","gulp-util":"~3.0.0","gulp-watch":"~4.3.0","gulp-concat":"~2.6.0","gulp-uglify":"~1.5.0","gulp-mocha":"~2.2.0","gulp-sass":"~2.1.1","gulp-wrap":"~0.11.0","yargs":"~3.32.0","mocha":"~2.3.0","should":"~8.0.0","jsdom":"~7.2.0","mocha-jsdom":"~1.0.0"},"gitHead":"e813596ce2b061dbbab6251d20b7c17edbfbd96c","bugs":{"url":"https://github.com/statgen/locuszoom/issues"},"_id":"locuszoom@0.5.2","_shasum":"108b279d3dae6785f15ee856f2bbb7da29ec623e","_from":".","_npmVersion":"2.14.7","_nodeVersion":"4.2.3","_npmUser":{"name":"frencil","email":"frencils@gmail.com"},"dist":{"shasum":"108b279d3dae6785f15ee856f2bbb7da29ec623e","tarball":"https://registry.npmjs.org/locuszoom/-/locuszoom-0.5.2.tgz","integrity":"sha512-MQK1g/9w5CeKy6v4VzsLo2caI3NQ6OXYMoyI+mN/aBneZPEQ3N7X/z4peAXTCAkp8kwTsCZ6VVO9fDThtkpfSg==","signatures":[{"keyid":"SHA256:jl3bwswu80PjjokCgh0o2w5c2U4LhQAE57gj9cz1kzA","sig":"MEYCIQCsN4P3eAVI1JQ8vJfAHllW6RjujIZrNETh4smKFPwIhQIhAJNRecFxOkdKrU4BYN/NJ3tE4sLRzcSixzg6pYRP8oDn"}]},"maintainers":[{"name":"frencil","email":"frencils@gmail.com"}],"_npmOperationalInternal":{"host":"packages-18-east.internal.npmjs.com","tmp":"tmp/locuszoom-0.5.2.tgz_1481831517569_0.5539530953392386"},"directories":{}},"0.5.3":{"name":"locuszoom","version":"0.5.3","description":"Generate interactive visualizations of statistical genetic data","keywords":["visualization","genetics","genes","gwas","phewas"],"homepage":"http://locuszoom.org","license":"MIT","author":{"name":"Christopher Clark","email":"chriclrk@umich.edu"},"main":"locuszoom.app.js","repository":{"type":"git","url":"git+https://github.com/statgen/locuszoom.git"},"scripts":{"test":"gulp test"},"dependencies":{"q":"~1.4.0","d3":"~3.5.0"},"devDependencies":{"gulp":"~3.9.0","gulp-util":"~3.0.0","gulp-watch":"~4.3.0","gulp-concat":"~2.6.0","gulp-uglify":"~1.5.0","gulp-mocha":"~2.2.0","gulp-sass":"~2.1.1","gulp-wrap":"~0.11.0","yargs":"~3.32.0","mocha":"~2.3.0","should":"~8.0.0","jsdom":"~7.2.0","mocha-jsdom":"~1.0.0"},"gitHead":"cb4f1dc9f0d0860a3f294e871fc66e09f8a03ba3","bugs":{"url":"https://github.com/statgen/locuszoom/issues"},"_id":"locuszoom@0.5.3","_shasum":"f027acae79255be71c36094c3f56638660812f05","_from":".","_npmVersion":"2.14.7","_nodeVersion":"4.2.3","_npmUser":{"name":"frencil","email":"frencils@gmail.com"},"dist":{"shasum":"f027acae79255be71c36094c3f56638660812f05","tarball":"https://registry.npmjs.org/locuszoom/-/locuszoom-0.5.3.tgz","integrity":"sha512-Y0KPaU1kNByXTSIanqvwpgfBVyIvA9rYdI00sh6j1bIWqG4g0yLQAwMz5ZXNSnbtRHKdW2VuQegWxL1VbEJL0A==","signatures":[{"keyid":"SHA256:jl3bwswu80PjjokCgh0o2w5c2U4LhQAE57gj9cz1kzA","sig":"MEYCIQCkyj/HYxHVt3ecFKZmgsl5xPaNAJ+2xjJEub35f0RxWgIhALlDvSqiLRndQQXQ+9fah971oD4AnlUQEqXmLDrVFPQJ"}]},"maintainers":[{"name":"frencil","email":"frencils@gmail.com"}],"_npmOperationalInternal":{"host":"packages-18-east.internal.npmjs.com","tmp":"tmp/locuszoom-0.5.3.tgz_1485457015808_0.89357466599904"},"directories":{}},"0.5.4":{"name":"locuszoom","version":"0.5.4","description":"Generate interactive visualizations of statistical genetic data","keywords":["visualization","genetics","genes","gwas","phewas"],"homepage":"http://locuszoom.org","license":"MIT","author":{"name":"Christopher Clark","email":"chriclrk@umich.edu"},"main":"locuszoom.app.js","repository":{"type":"git","url":"git+https://github.com/statgen/locuszoom.git"},"scripts":{"test":"gulp test"},"dependencies":{"q":"~1.4.0","d3":"~3.5.0"},"devDependencies":{"gulp":"~3.9.1","gulp-util":"~3.0.8","gulp-watch":"~4.3.11","gulp-concat":"~2.6.0","gulp-uglify":"~2.0.1","gulp-mocha":"~4.0.0","gulp-sass":"~3.1.0","gulp-wrap":"~0.13.0","yargs":"~6.6.0","mocha":"~3.2.0","should":"~11.2.0","jsdom":"~9.11.0","mocha-jsdom":"~1.1.0"},"gitHead":"7338ec4e581b7c5571e0e788273edeecd77ddad2","bugs":{"url":"https://github.com/statgen/locuszoom/issues"},"_id":"locuszoom@0.5.4","_shasum":"f2928467737ad9a27daf83df302aba7acb8c080c","_from":".","_npmVersion":"3.5.2","_nodeVersion":"4.2.6","_npmUser":{"name":"frencil","email":"frencils@gmail.com"},"dist":{"shasum":"f2928467737ad9a27daf83df302aba7acb8c080c","tarball":"https://registry.npmjs.org/locuszoom/-/locuszoom-0.5.4.tgz","integrity":"sha512-CKnn9lK+BVYdNx6BgbA9HyUdTiolYjD0mK0E3BtUWwAM9jmHee4w7C2T20Ow5Se87/Nu5GGWhLT3ct+9zgPheg==","signatures":[{"keyid":"SHA256:jl3bwswu80PjjokCgh0o2w5c2U4LhQAE57gj9cz1kzA","sig":"MEYCIQCtJZFDkRo9Ns6kFwh/zh8I9m4JyHuzpx6NMLRezw6XJQIhAMY2XdZjrHF4InIKoAWBSH/qpA61aidQBpbjDvBUwQje"}]},"maintainers":[{"name":"frencil","email":"frencils@gmail.com"}],"_npmOperationalInternal":{"host":"packages-12-west.internal.npmjs.com","tmp":"tmp/locuszoom-0.5.4.tgz_1487696441363_0.821372662903741"},"directories":{}},"0.5.6":{"name":"locuszoom","version":"0.5.6","description":"Generate interactive visualizations of statistical genetic data","keywords":["visualization","genetics","genes","gwas","phewas"],"homepage":"http://locuszoom.org","license":"MIT","author":{"name":"Christopher Clark","email":"chriclrk@umich.edu"},"main":"locuszoom.app.js","repository":{"type":"git","url":"git+https://github.com/statgen/locuszoom.git"},"scripts":{"test":"gulp test"},"dependencies":{"q":"~1.4.0","d3":"~3.5.0"},"devDependencies":{"gulp":"~3.9.1","gulp-util":"~3.0.8","gulp-watch":"~4.3.11","gulp-concat":"~2.6.0","gulp-uglify":"~2.0.1","gulp-mocha":"~4.0.0","gulp-sass":"~3.1.0","gulp-wrap":"~0.13.0","yargs":"~6.6.0","mocha":"~3.2.0","should":"~11.2.0","jsdom":"~9.11.0","mocha-jsdom":"~1.1.0"},"gitHead":"a8d4f7c9bb711a2bd42c2c288f86ecefe31e684b","bugs":{"url":"https://github.com/statgen/locuszoom/issues"},"_id":"locuszoom@0.5.6","_shasum":"37cba6eab26502b581300e37ca984bdde158bf05","_from":".","_npmVersion":"3.5.1","_nodeVersion":"5.0.0-pre","_npmUser":{"name":"frencil","email":"frencils@gmail.com"},"dist":{"shasum":"37cba6eab26502b581300e37ca984bdde158bf05","tarball":"https://registry.npmjs.org/locuszoom/-/locuszoom-0.5.6.tgz","integrity":"sha512-X3TABJlbfOxLVuR6kwMyK7bsSnE9oxkvcO3HqA3o6p0juiqO5OxDet5+irtJ/qgzQGcbKjMXih1ANTif4zM52w==","signatures":[{"keyid":"SHA256:jl3bwswu80PjjokCgh0o2w5c2U4LhQAE57gj9cz1kzA","sig":"MEUCIQCjHok+XdkMkNsfLFaxmRXiWYeEwAw2U2WlluQIT33iUgIgNn/CgPhZgSoPyxE9chLSIxXMQ714zPsmlu+2FFXlD3o="}]},"maintainers":[{"name":"frencil","email":"frencils@gmail.com"}],"_npmOperationalInternal":{"host":"packages-18-east.internal.npmjs.com","tmp":"tmp/locuszoom-0.5.6.tgz_1489720160210_0.7343637000303715"},"directories":{}},"0.6.0":{"name":"locuszoom","version":"0.6.0","description":"Generate interactive visualizations of statistical genetic data","keywords":["visualization","genetics","genes","gwas","phewas"],"homepage":"http://locuszoom.org","license":"MIT","author":{"name":"Christopher Clark","email":"chriclrk@umich.edu"},"main":"locuszoom.app.js","repository":{"type":"git","url":"git+https://github.com/statgen/locuszoom.git"},"scripts":{"gulp":"gulp","test":"eslint . && gulp test","eslint":"eslint ."},"dependencies":{"d3":"~3.5.0","q":"~1.4.0"},"devDependencies":{"eslint":"^4.3.0","gulp":"~3.9.1","gulp-concat":"~2.6.0","gulp-mocha":"~4.0.0","gulp-sass":"~3.1.0","gulp-uglify":"~2.0.1","gulp-util":"~3.0.8","gulp-watch":"~4.3.11","gulp-wrap":"~0.13.0","jsdoc":"^3.5.4","jsdom":"9.12.0","mocha":"~3.4.1","mocha-jsdom":"~1.1.0","should":"~11.2.0","yargs":"~6.6.0"},"gitHead":"972aa1bd72215a4498e7f04fe729b4337f888b17","bugs":{"url":"https://github.com/statgen/locuszoom/issues"},"_id":"locuszoom@0.6.0","_npmVersion":"5.5.1","_nodeVersion":"6.11.0","_npmUser":{"name":"abought","email":"abought@gmail.com"},"dist":{"integrity":"sha512-jPxKu9ZktXrJk8gqeZCDs1/BG5v/kKc6Sd01P6bXkiZ/G4YXUQ5oQGjnCvtsnzNGP+PsF2MJiMMctst+TFRLaw==","shasum":"9e8818465ea49a5f07d1c1b62309bf8693b9bcf3","tarball":"https://registry.npmjs.org/locuszoom/-/locuszoom-0.6.0.tgz","signatures":[{"keyid":"SHA256:jl3bwswu80PjjokCgh0o2w5c2U4LhQAE57gj9cz1kzA","sig":"MEYCIQD4eeyRtU9mCtDDt32KcIaDJRJaLKDg9mwBbZoyl5udQAIhAOGdNWc71RQUVS6z2dkYDN+X+Drbu54jvE1N5k/XVGA7"}]},"maintainers":[{"name":"abought","email":"abought@gmail.com"},{"name":"frencil","email":"frencils@gmail.com"}],"_npmOperationalInternal":{"host":"s3://npm-registry-packages","tmp":"tmp/locuszoom-0.6.0.tgz_1509050236834_0.13039624178782105"},"directories":{}},"0.6.1":{"name":"locuszoom","version":"0.6.1","description":"Generate interactive visualizations of statistical genetic data","keywords":["visualization","genetics","genes","gwas","phewas"],"homepage":"http://locuszoom.org","license":"MIT","author":{"name":"Christopher Clark","email":"chriclrk@umich.edu"},"main":"locuszoom.app.js","repository":{"type":"git","url":"git+https://github.com/statgen/locuszoom.git"},"scripts":{"gulp":"gulp","test":"eslint . && gulp test","eslint":"eslint ."},"dependencies":{"d3":"~3.5.0","q":"~1.4.0"},"devDependencies":{"eslint":"^4.3.0","gulp":"~3.9.1","gulp-concat":"~2.6.0","gulp-mocha":"~4.0.0","gulp-sass":"~3.1.0","gulp-uglify":"~2.0.1","gulp-util":"~3.0.8","gulp-watch":"~4.3.11","gulp-wrap":"~0.13.0","jsdoc":"^3.5.4","jsdom":"9.12.0","mocha":"~3.4.1","mocha-jsdom":"~1.1.0","should":"~11.2.0","yargs":"~6.6.0"},"gitHead":"410f52fd80eb4d4401cb445a02b9ad5d7361f413","bugs":{"url":"https://github.com/statgen/locuszoom/issues"},"_id":"locuszoom@0.6.1","_npmVersion":"5.5.1","_nodeVersion":"6.11.0","_npmUser":{"name":"abought","email":"abought@gmail.com"},"dist":{"integrity":"sha512-v4VuFh+UROL7GIF+M5eX4mDbEBDC0bAJAqUFZxp6g0Y1zwH0LdrazF6fZz/dHBGtz0xxnl91J5LH6nqTnSXsjA==","shasum":"4353fbb4939117bf8d3d5ceec91ae490192081c2","tarball":"https://registry.npmjs.org/locuszoom/-/locuszoom-0.6.1.tgz","signatures":[{"keyid":"SHA256:jl3bwswu80PjjokCgh0o2w5c2U4LhQAE57gj9cz1kzA","sig":"MEQCIBkmiol2UnCxaJOPu9W89U1RUJ182ZVQs76vFJblWcH7AiB6CRkhrZd3vumbmTE/bAOlcDOz/DF9lIwWI1kMF39LpA=="}]},"maintainers":[{"name":"abought","email":"abought@gmail.com"},{"name":"frencil","email":"frencils@gmail.com"}],"_npmOperationalInternal":{"host":"s3://npm-registry-packages","tmp":"tmp/locuszoom-0.6.1.tgz_1509052098411_0.24396708724088967"},"directories":{}},"0.7.0":{"name":"locuszoom","version":"0.7.0","description":"Generate interactive visualizations of statistical genetic data","keywords":["visualization","genetics","genes","gwas","phewas"],"homepage":"http://locuszoom.org","license":"MIT","author":{"name":"Christopher Clark","email":"chriclrk@umich.edu"},"contributors":[{"name":"Matthew Flickinger"},{"name":"Ryan Welch"},{"name":"Peter VandeHaar"},{"name":"Andy Boughton","email":"abought@umich.edu"}],"main":"dist/locuszoom.app.js","engines":{"node":">=6.12.0"},"repository":{"type":"git","url":"git+https://github.com/statgen/locuszoom.git"},"scripts":{"gulp":"gulp","build":"gulp css js","test":"gulp test","lint":"gulp lint.","watch":"gulp watch"},"dependencies":{"d3":"3.5.6","gulp-sourcemaps":"^2.6.1","q":"1.4.1"},"devDependencies":{"eslint":"^4.12.1","glob":"^7.1.2","gulp":"~3.9.1","gulp-concat":"~2.6.0","gulp-eslint":"^4.0.0","gulp-mocha":"~4.0.0","gulp-sass":"~3.1.0","gulp-uglify":"~2.0.1","gulp-util":"~3.0.8","gulp-watch":"~4.3.11","gulp-wrap":"~0.13.0","jsdoc":"^3.5.4","jsdom":"9.12.0","mocha":"~4.0.1","mocha-jsdom":"~1.1.0","should":"~13.1.3","yargs":"~10.0.3"},"gitHead":"7cd5d302295230ea09ca31dfa5bcd18fe8d67b2b","bugs":{"url":"https://github.com/statgen/locuszoom/issues"},"_id":"locuszoom@0.7.0","_npmVersion":"5.5.1","_nodeVersion":"8.9.1","_npmUser":{"name":"abought","email":"abought@gmail.com"},"dist":{"integrity":"sha512-6hJWh3b4nxe1IVAk5xvaZyMQAu0gCF1o4yU2hpU/XfuTyrZpel3FXT6ybY5BRWnUrOk5F6o0A3sgkR7bDOiGvA==","shasum":"0dfcd531cf51ebe4e6a2f52ed20b2a156a413f07","tarball":"https://registry.npmjs.org/locuszoom/-/locuszoom-0.7.0.tgz","signatures":[{"keyid":"SHA256:jl3bwswu80PjjokCgh0o2w5c2U4LhQAE57gj9cz1kzA","sig":"MEUCIAatWceFb7SiyDTu/2RpmJch5r1gqtqcSDyMqH5jMZW7AiEA2+X7ZrXGg538UhIOXF5J9Rsq1bpqEiUtr8MRGC3ugao="}]},"maintainers":[{"name":"abought","email":"abought@gmail.com"},{"name":"frencil","email":"frencils@gmail.com"}],"_npmOperationalInternal":{"host":"s3://npm-registry-packages","tmp":"tmp/locuszoom-0.7.0.tgz_1513881715459_0.9212898218538612"},"directories":{}},"0.7.1":{"name":"locuszoom","version":"0.7.1","description":"Generate interactive visualizations of statistical genetic data","keywords":["visualization","genetics","genes","gwas","phewas"],"homepage":"http://locuszoom.org","license":"MIT","author":{"name":"Christopher Clark","email":"chriclrk@umich.edu"},"contributors":[{"name":"Matthew Flickinger"},{"name":"Ryan Welch"},{"name":"Peter VandeHaar"},{"name":"Andy Boughton","email":"abought@umich.edu"}],"main":"dist/locuszoom.app.js","engines":{"node":">=6.12.0"},"repository":{"type":"git","url":"git+https://github.com/statgen/locuszoom.git"},"scripts":{"gulp":"gulp","build":"gulp css js","test":"gulp test","lint":"gulp lint","watch":"gulp watch"},"dependencies":{"d3":"3.5.6","gulp-sourcemaps":"^2.6.3","q":"1.4.1"},"devDependencies":{"eslint":"^4.15.0","glob":"^7.1.2","gulp":"~3.9.1","gulp-concat":"~2.6.0","gulp-eslint":"^4.0.1","gulp-mocha":"~4.0.0","gulp-sass":"~3.1.0","gulp-uglify":"~2.0.1","gulp-util":"~3.0.8","gulp-watch":"~4.3.11","gulp-wrap":"~0.13.0","jsdoc":"^3.5.5","jsdom":"9.12.0","mocha":"~4.0.1","mocha-jsdom":"~1.1.0","should":"~13.1.3","yargs":"~10.0.3"},"gitHead":"7a38aea8d09bc388ef1b0f8dafdda5ed14c2609d","bugs":{"url":"https://github.com/statgen/locuszoom/issues"},"_id":"locuszoom@0.7.1","_npmVersion":"5.5.1","_nodeVersion":"8.9.1","_npmUser":{"name":"abought","email":"abought@gmail.com"},"dist":{"integrity":"sha512-ARQyKjOGO7zDOxbK90oFjEdEaQkfwJUZOU0en/+juanSSuxr89F8dCiNkMM3fHF1D96SLyp2NWi0noId9UBJxw==","shasum":"63ceae0bc48af172575162fc38eec2b735c8cc97","tarball":"https://registry.npmjs.org/locuszoom/-/locuszoom-0.7.1.tgz","fileCount":78,"unpackedSize":4597426,"signatures":[{"keyid":"SHA256:jl3bwswu80PjjokCgh0o2w5c2U4LhQAE57gj9cz1kzA","sig":"MEUCIQCm/9fcDVaKaVI1Um2cL+mXSR3Vcvax3gQ8K+ge7y7xLAIgJA95J+gC7MH1gl1SMdEqobvLFBTmn2Tj3qt6RVB1Xyw="}]},"maintainers":[{"name":"abought","email":"abought@gmail.com"},{"name":"frencil","email":"frencils@gmail.com"}],"directories":{},"_npmOperationalInternal":{"host":"s3://npm-registry-packages","tmp":"tmp/locuszoom_0.7.1_1518721819348_0.4487972967766778"},"_hasShrinkwrap":false},"0.7.2":{"name":"locuszoom","version":"0.7.2","description":"Generate interactive visualizations of statistical genetic data","keywords":["visualization","genetics","genes","gwas","phewas"],"homepage":"http://locuszoom.org","license":"MIT","author":{"name":"Christopher Clark","email":"chriclrk@umich.edu"},"contributors":[{"name":"Matthew Flickinger"},{"name":"Ryan Welch"},{"name":"Peter VandeHaar"},{"name":"Andy Boughton","email":"abought@umich.edu"}],"main":"dist/locuszoom.app.js","engines":{"node":">=6.12.0"},"repository":{"type":"git","url":"git+https://github.com/statgen/locuszoom.git"},"scripts":{"gulp":"gulp","build":"gulp css js","test":"gulp test","lint":"gulp lint","watch":"gulp watch"},"dependencies":{"d3":"3.5.6","gulp-sourcemaps":"^2.6.3","q":"1.4.1"},"devDependencies":{"eslint":"^4.15.0","glob":"^7.1.2","gulp":"~3.9.1","gulp-concat":"~2.6.0","gulp-eslint":"^4.0.1","gulp-mocha":"~4.0.0","gulp-sass":"~3.1.0","gulp-uglify":"~2.0.1","gulp-util":"~3.0.8","gulp-watch":"~4.3.11","gulp-wrap-js":"^0.4.1","jsdoc":"^3.5.5","jsdom":"9.12.0","mocha":"~4.0.1","mocha-jsdom":"~1.1.0","should":"~13.1.3","yargs":"~10.0.3"},"gitHead":"aacedfcf006490b7814ce6e96e0a0b06100373a5","bugs":{"url":"https://github.com/statgen/locuszoom/issues"},"_id":"locuszoom@0.7.2","_npmVersion":"5.5.1","_nodeVersion":"8.9.1","_npmUser":{"name":"abought","email":"abought@gmail.com"},"dist":{"integrity":"sha512-iAk89KXPG4M8/BoH288T9w43Ob7QQz+bp74mKRj6CyZZ0O+RJiyw2OrBc9P1dQy1SGSzbcjib/6m84FqoNGO6g==","shasum":"b64c73537a52e110c17c51e7d2e5eafeb4adad41","tarball":"https://registry.npmjs.org/locuszoom/-/locuszoom-0.7.2.tgz","fileCount":80,"unpackedSize":5338081,"npm-signature":"-----BEGIN PGP SIGNATURE-----\r\nVersion: OpenPGP.js v3.0.4\r\nComment: https://openpgpjs.org\r\n\r\nwsFcBAEBCAAQBQJa3iIRCRA9TVsSAnZWagAAGWkP/1pgFTt1dYUJrgzDo6as\n9czDvK2XKMOr1Y+mNWL4yZgJ2GDVRGY6W5hh0PWfiJqMKKIC/pdr6/L9uaq0\nKCdva4Q3leljCDTUpv9igLT67RtSCix4Ddm+O5pVYNIbneN3o3RlVuiBCtWy\nLIigBAHv3ooOZGZg04ynjRL7QXANc2Zq2uvYtMUMjF/KXyZNj5v/IV4cpNqt\nwXFgJIm9/l1TVPra6PGCDL3JdcD/ppztWLgMivs1A1F8gJY6/aEAcJ7GqjX3\nA286gMVWwjjcJmfEy5AOQtnp3hP2wd/pxglisUYJZtLtVZ3M3Q1Ot6Qe9qHV\nzhy5uofulGUZogBCuasbvnx9oRJkcRwXPLhy0klshD4byp0yIgVONo5GY//K\nOWOWwFtF2AO6Ra1eidA/df9rv1T1J0WZ/CsdF0RCzscre3ZhXOeeNT7oR2JN\nCfKDoJL0xOeFMzxzPfvZu7vLMCcoxGrh/jH7Hep+MsAUXBTRUnOqhAqSvBHY\nyCiCRgpdRRvjYrloQBSQPdcqCnCoaX/vk45/1gHEwU7kRhNwQKBxEjz1u99y\ndPj0idagQz2mVDf+I7CNcDnb5npHsSWn6WQ6wH1Xz886wwJWzFLLvhqlShll\nLIOdvlCcQ3roLbJnePYqShy4RGUyXtbFec2kVLGdaZ9g9vg26u+yWHeWOolh\nJmJ8\r\n=uvMx\r\n-----END PGP SIGNATURE-----\r\n","signatures":[{"keyid":"SHA256:jl3bwswu80PjjokCgh0o2w5c2U4LhQAE57gj9cz1kzA","sig":"MEUCIQDNhNVs7mNOPvC+c+c90S2YEp7kTiYYEebQdGlsDSCx1QIgLh0jzaGZ0/VLKv10pKGmmdi7hj5LIoYtwynPABNbtj0="}]},"maintainers":[{"name":"abought","email":"abought@gmail.com"},{"name":"frencil","email":"frencils@gmail.com"}],"directories":{},"_npmOperationalInternal":{"host":"s3://npm-registry-packages","tmp":"tmp/locuszoom_0.7.2_1524507152512_0.09376438930543829"},"_hasShrinkwrap":false},"0.8.0":{"name":"locuszoom","version":"0.8.0","description":"Generate interactive visualizations of statistical genetic data","keywords":["visualization","genetics","genes","gwas","phewas"],"homepage":"http://locuszoom.org","license":"MIT","author":{"name":"Christopher Clark","email":"chriclrk@umich.edu"},"contributors":[{"name":"Matthew Flickinger"},{"name":"Ryan Welch"},{"name":"Peter VandeHaar"},{"name":"Andy Boughton","email":"abought@umich.edu"}],"main":"dist/locuszoom.app.js","engines":{"node":">=6.12.0"},"repository":{"type":"git","url":"git+https://github.com/statgen/locuszoom.git"},"scripts":{"gulp":"gulp","build":"gulp build","test":"gulp test","lint":"gulp lint","watch":"gulp watch"},"dependencies":{"d3":"3.5.6","q":"1.4.1"},"devDependencies":{"del":"^3.0.0","eslint":"^4.15.0","glob":"^7.1.2","gulp":"~3.9.1","gulp-concat":"~2.6.0","gulp-eslint":"^4.0.1","gulp-filter":"^5.1.0","gulp-mocha":"~4.0.0","gulp-rename":"^1.2.2","gulp-sass":"~3.1.0","gulp-sourcemaps":"^2.6.3","gulp-uglify":"~2.0.1","gulp-util":"~3.0.8","gulp-watch":"~4.3.11","gulp-wrap-js":"^0.4.1","jsdoc":"^3.5.5","jsdom":"9.12.0","mocha":"~4.0.1","mocha-jsdom":"~1.1.0","should":"~13.1.3","sinon":"^4.5.0","yargs":"~10.0.3"},"gitHead":"5190d7ff13bb75bc4d17d8460e85d0c1229adb77","bugs":{"url":"https://github.com/statgen/locuszoom/issues"},"_id":"locuszoom@0.8.0","_npmVersion":"6.1.0","_nodeVersion":"8.11.3","_npmUser":{"name":"abought","email":"abought@gmail.com"},"dist":{"integrity":"sha512-FA9gAPoDFggFzXOfehPg4sITV6M1G6qAGOL1WNbjHCwHDzjsbQ+FC4ITNVKca1e8fkaGPafitfI80+xk8SFXWg==","shasum":"1998e19858478410a081c45e29ce792f8755cab7","tarball":"https://registry.npmjs.org/locuszoom/-/locuszoom-0.8.0.tgz","fileCount":85,"unpackedSize":6340819,"npm-signature":"-----BEGIN PGP SIGNATURE-----\r\nVersion: OpenPGP.js v3.0.4\r\nComment: https://openpgpjs.org\r\n\r\nwsFcBAEBCAAQBQJbMoPmCRA9TVsSAnZWagAA7C4P/2gpSrDKEPjuDQ4AyRR4\ntCrzLF/7SMTGZvQeElh3Wmh7gN+TXDblRIDF7uNx4STe6VwedOBSYDe6xknF\npmWjdhMgKLO2csm0JdQESitn8/4ttb3+ZnuvDqgNpGMUdHSTCkDNnhOal/jx\ncgs5vabdh9W9gCpz6qCd1ywW22fHVX44OP78Y6hUH+15DC7HIGxmBpZ44SBw\n5BZ9lfavSCmQ7iA3Qpoi7ePxTcicW59vzJWhUUmnun00wkw3kiaESG39JJTx\n062dSL6Bzo29ZqRKlP094Qo+tCAPCjOLNTqtTmyTWH2KpwH4redHuKWcVDfn\nwRkfzXXGTu51A2k3/CJZkiXXpZWhfE6SH1LcrT/o9S9YJoKmPoaJS8EPjiqu\n2+zd1Cxy+0TkeooOcCH6LJH8zlQFNz7O79yhf+qr1cbsh0ZgIW1Vf20GNfGQ\nj3Keec8OlOl9FXBURf0jM2K05usz7Gj3WdkZHS7u6VDvSe4j4rEnTrziLgDY\nT9j2NDS1nQjI/SOc/g09ObnUdMiQJpoJ0X4PER1TiGO+A7V7ZTXvmSJp/TgT\nkJnIUD5j1/yQcP6dsAF4S+d+vtxU0q91RNUpL2ksYBUkbIMr1p9W3PRHBXEk\nY7owiZmOXB9kKE6cbf2Xa8seniFf68TC3AnNMrRp05LcAYAk1BZ+BQrgw+Hk\nNH2+\r\n=fhjX\r\n-----END PGP SIGNATURE-----\r\n","signatures":[{"keyid":"SHA256:jl3bwswu80PjjokCgh0o2w5c2U4LhQAE57gj9cz1kzA","sig":"MEYCIQDfjJ0yR3x1Hex5ro4BLYD0PC3/YJNWvBQO8+obMMbuIgIhAMS8QhZy/BM+gnQFaS/fmHvYmt8jJZP0Ylv0S226YDyK"}]},"maintainers":[{"name":"abought","email":"abought@gmail.com"},{"name":"frencil","email":"frencils@gmail.com"}],"directories":{},"_npmOperationalInternal":{"host":"s3://npm-registry-packages","tmp":"tmp/locuszoom_0.8.0_1530037222313_0.31355548249348186"},"_hasShrinkwrap":false},"0.8.1":{"name":"locuszoom","version":"0.8.1","description":"Generate interactive visualizations of statistical genetic data","keywords":["visualization","genetics","genes","gwas","phewas"],"homepage":"http://locuszoom.org","license":"MIT","author":{"name":"Christopher Clark","email":"chriclrk@umich.edu"},"contributors":[{"name":"Matthew Flickinger"},{"name":"Ryan Welch"},{"name":"Peter VandeHaar"},{"name":"Andy Boughton","email":"abought@umich.edu"}],"main":"dist/locuszoom.app.js","engines":{"node":">=6.12.0"},"repository":{"type":"git","url":"git+https://github.com/statgen/locuszoom.git"},"scripts":{"gulp":"gulp","build":"gulp build","test":"gulp test","lint":"gulp lint","watch":"gulp watch"},"dependencies":{"d3":"3.5.6","q":"1.4.1"},"devDependencies":{"del":"~3.0.0","eslint":"~5.2.0","glob":"~7.1.2","gulp":"~3.9.1","gulp-concat":"~2.6.1","gulp-eslint":"~5.0.0","gulp-filter":"^5.1.0","gulp-mocha":"~6.0.0","gulp-rename":"~1.4.0","gulp-sass":"~4.0.1","gulp-sourcemaps":"~2.6.4","gulp-uglify":"~3.0.1","gulp-util":"~3.0.8","gulp-watch":"~5.0.1","gulp-wrap-js":"~0.4.1","jsdoc":"^3.5.5","jsdom":"~9.12.0","mocha":"~5.2.0","mocha-jsdom":"~2.0.0","should":"~13.2.1","sinon":"~6.1.4","yargs":"~12.0.1"},"gitHead":"2da2ac012274e550ce47c47cb7a9e07ef7fde169","bugs":{"url":"https://github.com/statgen/locuszoom/issues"},"_id":"locuszoom@0.8.1","_npmVersion":"6.1.0","_nodeVersion":"8.11.3","_npmUser":{"name":"abought","email":"abought@gmail.com"},"dist":{"integrity":"sha512-m+1RQq53kgTqiN6yMHtrArltc7W1Pd/jnBF5TsZ8EMgU8ZTKObaWfUk1gTHMFPVRVvHXw2jaDw1/4Itqj2R84Q==","shasum":"1f61e438b3f41416fe9ab36b1c668214fa2dc4fd","tarball":"https://registry.npmjs.org/locuszoom/-/locuszoom-0.8.1.tgz","fileCount":86,"unpackedSize":6985004,"npm-signature":"-----BEGIN PGP SIGNATURE-----\r\nVersion: OpenPGP.js v3.0.4\r\nComment: https://openpgpjs.org\r\n\r\nwsFcBAEBCAAQBQJbmq7UCRA9TVsSAnZWagAAfnEP+wXI1v9pMLeuYEwS8RVz\ns6y1+/jGou7qPpzhc065w4AUYncFksI6pOKqCwlPVUrkh/Kz+ktRYH9BB1ab\nK+osd4DXdJw6KMW87fwKNMrX3yivg6ArDg+GMlnljcQDYYT6rX5BFsCeptwZ\nMtE93ddHG6ydbZVEv9y5kKRo5HOPnf0Ffy2/7VLHHbrA+Y2g4/W30c34L83T\nQJGv4CoG3sGJzWbMu9DFufYOZPaPruX8yPuSR7SnbFNqhwdswjAzmHiRye0q\nu4QZ9waQWjmjkXi6rKepCSmBBbUb2yg5sNPK4FhRsAttW7S5D/pu8HFq2XI+\ny1feZuk4OCJQ8igraj6zVkMUVMvY2km+QoGjusAxctOw6awWpDWq1CY6SC4L\n8iwZrOi6EZ/luqk10dfdXij3fJZqqRKDyfQshMY390LVIIg195ckEXcyj40U\n/LP6v9p6jsGv+ehSg8zErc1P7amFIp13kW3pDDuYqf/oKCohL1Vk3mUNFEXU\n9QjI+uyauaaFzY4IQUdKenBK0cicXdooZKZmlt9ppuibQfC68Hlrd3w7bCEg\neuhcI2VveFgzKV1zhyRlr0XPPGXNKKfKYZyQkFuYbbt7cztWz8kqNH1Uye9r\nQuTwFrGTEXb45v4KjdMiIF70LJ36Nc/nO74ndPqbRV/whTC0y11QY2uwhiP2\nnoil\r\n=KaJS\r\n-----END PGP SIGNATURE-----\r\n","signatures":[{"keyid":"SHA256:jl3bwswu80PjjokCgh0o2w5c2U4LhQAE57gj9cz1kzA","sig":"MEUCICbcugaimespfd/fv8rj/HkFouDiuUt8iTiV/p+5YmaVAiEAyNBqKUiDwzmwP+ZcLvAb6LLn9iGzThjrno4oAnAbblg="}]},"maintainers":[{"name":"abought","email":"abought@gmail.com"},{"name":"frencil","email":"frencils@gmail.com"}],"directories":{},"_npmOperationalInternal":{"host":"s3://npm-registry-packages","tmp":"tmp/locuszoom_0.8.1_1536863955407_0.44386987351768314"},"_hasShrinkwrap":false},"0.8.2":{"name":"locuszoom","version":"0.8.2","description":"Generate interactive visualizations of statistical genetic data","keywords":["visualization","genetics","genes","gwas","phewas"],"homepage":"http://locuszoom.org","license":"MIT","author":{"name":"Christopher Clark","email":"chriclrk@umich.edu"},"contributors":[{"name":"Matthew Flickinger"},{"name":"Ryan Welch"},{"name":"Peter VandeHaar"},{"name":"Andy Boughton","email":"abought@umich.edu"}],"main":"dist/locuszoom.app.js","engines":{"node":">=6.12.0"},"repository":{"type":"git","url":"git+https://github.com/statgen/locuszoom.git"},"scripts":{"gulp":"gulp","build":"gulp build","test":"gulp test","lint":"gulp lint","watch":"gulp watch"},"dependencies":{"d3":"3.5.6","q":"1.4.1"},"devDependencies":{"del":"~3.0.0","eslint":"~5.2.0","glob":"~7.1.2","gulp":"~3.9.1","gulp-concat":"~2.6.1","gulp-eslint":"~5.0.0","gulp-filter":"^5.1.0","gulp-mocha":"~6.0.0","gulp-rename":"~1.4.0","gulp-sass":"~4.0.1","gulp-sourcemaps":"~2.6.4","gulp-uglify":"~3.0.1","gulp-util":"~3.0.8","gulp-watch":"~5.0.1","gulp-wrap-js":"~0.4.1","jsdoc":"^3.5.5","jsdom":"~9.12.0","mocha":"~5.2.0","mocha-jsdom":"~2.0.0","should":"~13.2.1","sinon":"~6.1.4","yargs":"~12.0.1"},"gitHead":"ac892ff0f37cb9ea6c0626a71ae1fce4f9235077","bugs":{"url":"https://github.com/statgen/locuszoom/issues"},"_id":"locuszoom@0.8.2","_npmVersion":"6.1.0","_nodeVersion":"8.11.3","_npmUser":{"name":"abought","email":"abought@gmail.com"},"dist":{"integrity":"sha512-lhtRLHWl+S5gEAp0UQDyEF5BPcjYO3N0YLedA4wrcg9xnUcYp5ysBKVv+0K5NJtwpF6uCodC/JZS21HKuQnIbQ==","shasum":"06e6f8207ea591a2b743656ccbcef3e598feca8a","tarball":"https://registry.npmjs.org/locuszoom/-/locuszoom-0.8.2.tgz","fileCount":87,"unpackedSize":7003327,"npm-signature":"-----BEGIN PGP SIGNATURE-----\r\nVersion: OpenPGP.js v3.0.4\r\nComment: https://openpgpjs.org\r\n\r\nwsFcBAEBCAAQBQJboB6UCRA9TVsSAnZWagAA1XMP/1xjxcDB4cy+9XuZHJUr\nTjQz2mXWCeKqalUErMqmjBhO2IzbQakc7a10+eG97zm/QHk9tFTk0zNFfA2e\nVmXrvd77YYsuFxfbh6dVBfkCzjJweB01B3sk5gffjdI5ZcqMsIDdMnskHMqE\n+pBCN5fDvwIYpAviV2Ggc9n3n0GCyYtyRRuj/4R5P0V5OlTnYz5/o8YPiSXU\nvYRVG2vfM8J6eLxlY9n0fEx5FRHu/uAbi9EfyyuiW1o12WgXNKCgbkls/vCk\nRv4nECR7Dm7YOupqLBUdzs7JiSLoOm3QFSbM9OZaYOv8nqPE2Dq86PvOp5QP\nEviOY95BoS0FNtAvm6sG0NqZ97o0ulHj9qROTUfCJn9f+nprZJB+7/IbnfNf\nQ2DqoF+PFK9QORkG6x27rR664E5HEYhgFpH/Cp+lsNcNZqJRzVwcNohE25r2\nFqpleWIOaffSCLg0YIWq/3ZaARdKohtFK6rVJJN2jQYCdw2sgu1WDtDJw7xV\nM+cWOgDpJ53ZfjTxP9tPTZ4drBRspLbExLTJKKuU10yeG+tmSXrJ6zMTC6fh\nTPgIqGT0lUM16/dTf1xdvJopyhrtJrY9qKCLracs2cXGkqwkIe+Okh266+jO\npd2UtIGoL7OpQ5CojQHoKeZa4Ov2K/bCh0ETr1npnaMP8uFFVtK7ikLIBwS4\n+gNq\r\n=2fnT\r\n-----END PGP SIGNATURE-----\r\n","signatures":[{"keyid":"SHA256:jl3bwswu80PjjokCgh0o2w5c2U4LhQAE57gj9cz1kzA","sig":"MEQCIECt/SUvkR1Vn3KhiyKfEp2EoeON+kAAUASBMGbZ7h7cAiATcmBUjAhroXHxxmAUGB+Q0ROCzCrAUPOWhQvUOloklg=="}]},"maintainers":[{"name":"abought","email":"abought@gmail.com"},{"name":"frencil","email":"frencils@gmail.com"}],"directories":{},"_npmOperationalInternal":{"host":"s3://npm-registry-packages","tmp":"tmp/locuszoom_0.8.2_1537220244029_0.6679534088916719"},"_hasShrinkwrap":false},"0.9.0":{"name":"locuszoom","version":"0.9.0","description":"Generate interactive visualizations of statistical genetic data","keywords":["visualization","genetics","genes","gwas","phewas"],"homepage":"http://locuszoom.org","license":"MIT","author":{"name":"Christopher Clark","email":"chriclrk@umich.edu"},"contributors":[{"name":"Matthew Flickinger"},{"name":"Ryan Welch"},{"name":"Peter VandeHaar"},{"name":"Andy Boughton","email":"abought@umich.edu"}],"main":"dist/locuszoom.app.min.js","engines":{"node":">=6.12.0"},"repository":{"type":"git","url":"git+https://github.com/statgen/locuszoom.git"},"scripts":{"build":"gulp build","test":"gulp test","lint":"gulp lint","watch":"gulp watch"},"dependencies":{"d3":"3.5.17","q":"1.4.1"},"devDependencies":{"del":"~3.0.0","eslint":"~5.7.0","glob":"^7.1.3","gulp":"^4.0.0","gulp-concat":"~2.6.1","gulp-eslint":"~5.0.0","gulp-filter":"^5.1.0","gulp-mocha":"~6.0.0","gulp-rename":"~1.4.0","gulp-sass":"~4.0.2","gulp-sourcemaps":"~2.6.4","gulp-uglify":"~3.0.1","gulp-util":"~3.0.8","gulp-watch":"~5.0.1","gulp-wrap-js":"~0.4.1","jsdoc":"^3.5.5","jsdom":"~9.12.0","mocha":"~5.2.0","mocha-jsdom":"~2.0.0","should":"^13.2.3","sinon":"^6.1.6","yargs":"^12.0.2"},"gitHead":"62f20ea29b357c9af53879857339caaeb4aa0407","bugs":{"url":"https://github.com/statgen/locuszoom/issues"},"_id":"locuszoom@0.9.0","_npmVersion":"6.5.0","_nodeVersion":"8.11.3","_npmUser":{"name":"abought","email":"abought@gmail.com"},"dist":{"integrity":"sha512-DccxdCUYS5EnEKNwch8Wing5ZUPliGeYqP1s6rNp8iUTGcfvzOG6ASHNJcaogblcwRyzQrt33oxSJpvF8BrJlQ==","shasum":"2b107e6f17f7a62f7181559c61eb023264ecf8df","tarball":"https://registry.npmjs.org/locuszoom/-/locuszoom-0.9.0.tgz","fileCount":90,"unpackedSize":7232759,"npm-signature":"-----BEGIN PGP SIGNATURE-----\r\nVersion: OpenPGP.js v3.0.4\r\nComment: https://openpgpjs.org\r\n\r\nwsFcBAEBCAAQBQJcGrSICRA9TVsSAnZWagAAdQIP/3ePoB+pfWWIBsHk0Xe0\nIAmWA+85NVllBMr+51VtFsf0s3S1F/NiKFpQzHMAdBDtPJCiZBltSm7i7IZ+\nlalUVSGjeIayVXcr7HYwCpY12AsLe9YRXV2r/Uo5AbJw9R4tfXeOt7YmlNZ7\nF/rKyYZv1vH5xCehwZZItjR1iY7eRubVgBxlqocT/cSGrma30JGsSNqP7hr9\nZBEIzeEqhGjgzfsuC8JaZC/1fwMAL8AYvT4cIyRGPMPUwmpcEuC1AiqJc8X4\nCyJCKwZ4gPlVzS9C80feF0YmLwGrVOqL0Eqf3jR3gTWMOfPuw7VgHNdQogZq\npUFkAyMx7YLhZufqlSyeHfX2ZXLpXCognMg78DKg1OlDVBPRDXy1GHOiQy3e\nL5bZ8boB9/+xe5j6bmGcAhfVfidK+Q0CdHraE99JxjX2Fu6t3mVfjORt7NPl\nANxBQPFO+L2rZFW33tJ0Co/Z/7KhJi1IpArmtyaoLKPjycn43UQCpofKKGcs\nz3OsawDA0miEyJ2tS5XRDM3NgGQXXpvzD0QvpwfISXz8DDfq3OZuMttFu+wL\n8hLhKu3fOo73X5AG/efsh+HrK0AupzQe2FkcuGjumUcwnxyIU7agMlH1sJkn\nr/Uupc5jPYLMSGC4ofPqlhBUUpakEU5JkkEdI8PKnYexd68VO15BGkuBPk2/\nNuba\r\n=ulh/\r\n-----END PGP SIGNATURE-----\r\n","signatures":[{"keyid":"SHA256:jl3bwswu80PjjokCgh0o2w5c2U4LhQAE57gj9cz1kzA","sig":"MEUCIDyOrvj4gcaY3AeZtWyqw4UdAbwWP4eLynR9it0D7xdsAiEAh8OQ4ICxUUPxQVzvoJ2wcZ/5J78spSFyLhMJ0sJPmXw="}]},"maintainers":[{"name":"abought","email":"abought@gmail.com"},{"name":"frencil","email":"frencils@gmail.com"}],"directories":{},"_npmOperationalInternal":{"host":"s3://npm-registry-packages","tmp":"tmp/locuszoom_0.9.0_1545254024011_0.1567127703249218"},"_hasShrinkwrap":false},"0.9.1":{"name":"locuszoom","version":"0.9.1","description":"Generate interactive visualizations of statistical genetic data","keywords":["visualization","genetics","genes","gwas","phewas"],"homepage":"http://locuszoom.org","license":"MIT","author":{"name":"Christopher Clark","email":"chriclrk@umich.edu"},"contributors":[{"name":"Matthew Flickinger"},{"name":"Ryan Welch"},{"name":"Peter VandeHaar"},{"name":"Andy Boughton","email":"abought@umich.edu"}],"main":"dist/locuszoom.app.min.js","engines":{"node":">=6.12.0"},"repository":{"type":"git","url":"git+https://github.com/statgen/locuszoom.git"},"scripts":{"build":"gulp build","test":"gulp test","lint":"gulp lint","watch":"gulp watch"},"dependencies":{"d3":"3.5.17","q":"1.4.1"},"devDependencies":{"del":"~3.0.0","eslint":"^5.16.0","glob":"^7.1.3","gulp":"^4.0.0","gulp-concat":"~2.6.1","gulp-eslint":"~5.0.0","gulp-filter":"^5.1.0","gulp-mocha":"~6.0.0","gulp-rename":"~1.4.0","gulp-sass":"~4.0.2","gulp-sourcemaps":"~2.6.4","gulp-uglify":"~3.0.1","gulp-util":"~3.0.8","gulp-watch":"~5.0.1","gulp-wrap-js":"~0.4.1","jsdoc":"^3.5.5","jsdom":"~9.12.0","mocha":"~5.2.0","mocha-jsdom":"~2.0.0","should":"^13.2.3","sinon":"^6.1.6","yargs":"^12.0.2"},"gitHead":"d28a9bd605ae1b40b69451532d22c9c0878ae4a9","bugs":{"url":"https://github.com/statgen/locuszoom/issues"},"_id":"locuszoom@0.9.1","_npmVersion":"6.5.0","_nodeVersion":"8.11.3","_npmUser":{"name":"abought","email":"abought@gmail.com"},"dist":{"integrity":"sha512-zx5O/4P2LzzIiqN9O0lR8X6K1QuMf3I6GQRfPIxDZPgbujdgj78ebdRBvQFP3rPacjHCCeJQPc437El0D4+3vg==","shasum":"edd4b010af9d5bc6059ddbaea7eac69c44205ecc","tarball":"https://registry.npmjs.org/locuszoom/-/locuszoom-0.9.1.tgz","fileCount":90,"unpackedSize":7266297,"npm-signature":"-----BEGIN PGP SIGNATURE-----\r\nVersion: OpenPGP.js v3.0.4\r\nComment: https://openpgpjs.org\r\n\r\nwsFcBAEBCAAQBQJc7tzVCRA9TVsSAnZWagAA+zUP/jL3iVu/a2pOiaE5juZ2\n7h2N/STmg2mUsQaTgyqGCXYkvbjYzOqnzJstRc6thjocI/3Av6OVbNw1a7lB\n8YF+TNa1ZOmR9XonvWwDKu4h5znah5Qq3QkNCyygYnnKv6iK4UeVlLhYJW8U\n3+2SyVaQjLSlJEt3m33ZuMuLzjJLdFAxJ6RpoeXgSeugPZ9hr+g02NKSTpZk\ndCSp0sBe/vfMNVhgG8630dh/eLyrjXPRhhZKX1B2XBk5MdIcKPWNevtTs6XV\n0wZFE4ULi2CODUjrviAvwnfnD3kxAWy/GDpG0cdOkBKSZBs1B3ThOvuNN0i+\n14Rhgkb2/IqFtqde3hM/oSdXGE7lCcwIAWAx6hA/j7U4ZDlKODqYDmOK8Kg6\nAJG9jHoTJAfVOHG/PvbPwfLK8wgGEKk2I9LHxEeV006UFjXN6qJGE+Xjy6qI\nopDqyWvaR90ekOdFmk3IkukZYlTj4kWMKocxgHpfxqYOenFoUXw60uKhTQxv\nqhMO+3I4FaIAXmLJ3ug4H+VBaB/qxm3upCgJdJzIijsM5hATrzfQXMu9bcSY\nytWLfPXLmz/dhRQf+K+bqS7QXe8SdMA31hhYdVnZSF7UtiSjcnlwv+RfwJr4\nCH5w0ZBjg1e4UZCt9+pXu1TiOJQkFSexQjCLwzhP3ocGWHe0cAz2M4iSAdwc\nSnJU\r\n=sy6y\r\n-----END PGP SIGNATURE-----\r\n","signatures":[{"keyid":"SHA256:jl3bwswu80PjjokCgh0o2w5c2U4LhQAE57gj9cz1kzA","sig":"MEQCIDbFDcM4ud/YhAN2OH92ySUe59byjDUgRDxkjwUqjdYZAiBFmVzB99Wp9MIjQJvegKdf7uO+5iHXgCMfHsWrzOhxdw=="}]},"maintainers":[{"name":"abought","email":"abought@gmail.com"},{"name":"frencil","email":"frencils@gmail.com"}],"directories":{},"_npmOperationalInternal":{"host":"s3://npm-registry-packages","tmp":"tmp/locuszoom_0.9.1_1559157973138_0.5517376807328149"},"_hasShrinkwrap":false},"0.10.0-beta.1":{"name":"locuszoom","version":"0.10.0-beta.1","description":"Generate interactive visualizations of statistical genetic data","keywords":["visualization","genetics","genes","gwas","phewas"],"homepage":"http://locuszoom.org","license":"MIT","author":{"name":"Christopher Clark","email":"chriclrk@umich.edu"},"contributors":[{"name":"Matthew Flickinger"},{"name":"Ryan Welch"},{"name":"Peter VandeHaar"},{"name":"Andy Boughton","email":"abought@umich.edu"}],"main":"dist/locuszoom.app.min.js","engines":{"node":">=6.12.0"},"repository":{"type":"git","url":"git+https://github.com/statgen/locuszoom.git"},"scripts":{"build":"gulp build","test":"gulp test","lint":"gulp lint","watch":"gulp watch"},"dependencies":{"d3":"3.5.17","promise-polyfill":"^8.1.3"},"devDependencies":{"del":"~3.0.0","eslint":"^5.16.0","glob":"^7.1.3","gulp":"^4.0.0","gulp-concat":"~2.6.1","gulp-eslint":"~5.0.0","gulp-filter":"^5.1.0","gulp-mocha":"~6.0.0","gulp-rename":"~1.4.0","gulp-sass":"~4.0.2","gulp-sourcemaps":"~2.6.4","gulp-uglify":"~3.0.1","gulp-util":"~3.0.8","gulp-watch":"~5.0.1","gulp-wrap-js":"~0.4.1","jsdoc":"^3.5.5","jsdom":"~9.12.0","mocha":"~5.2.0","mocha-jsdom":"~2.0.0","should":"^13.2.3","sinon":"^6.1.6","yargs":"^12.0.2"},"readme":"# LocusZoom\n\nLocusZoom is a Javascript/d3 embeddable plugin for interactively visualizing statistical genetic data from customizable\n sources.\n\n[](https://api.travis-ci.org/statgen/locuszoom)\n\nSee [github.com/statgen/locuszoom/wiki](https://github.com/statgen/locuszoom/wiki) for full documentation and API reference.\n\nTo see functional examples of plots generated with LocusZoom.js see [statgen.github.io/locuszoom](http://statgen.github.io/locuszoom/) \nand [statgen.github.io/locuszoom/#examples](http://statgen.github.io/locuszoom/#examples).\n\n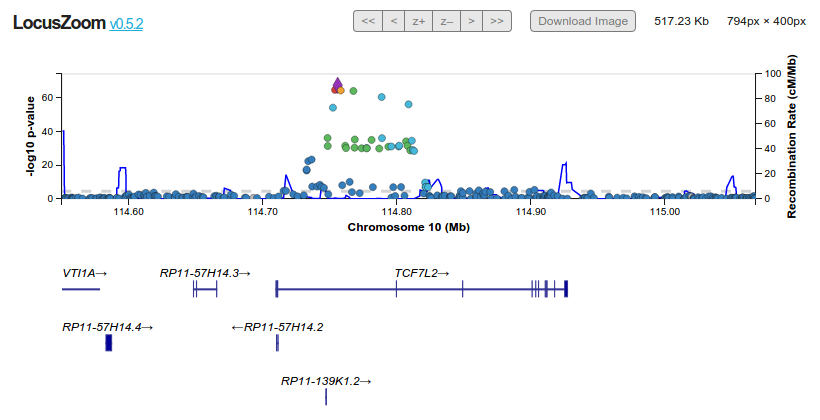\n\n## Making a LocusZoom Plot\n\n### 1. Include Necessary JavaScript and CSS\n\nThe page you build that embeds the LocusZoom plugin must include the following resources, found in the `dist` directory:\n\n* `locuszoom.vendor.min.js` \n This file contains the concatenated vendor libraries. You can alternatively include [d3](http://d3js.org/)\n from other sources, so long as it is included **before including LocusZoom files**. This bundle also contains a \n polyfill for ES6 `Promise`, which you may need if your site supports certain older browsers such as Internet Explorer.\n\n* `locuszoom.app.js` OR `locuszoom.app.min.js` \n This is the primary application logic. It should only be included *after* the vendor dependencies have been included. \n\n* `locuszoom.css` \n This is the primary stylesheet. It is namespaced so as not to conflict with any other styles defined on the same page.\n\nCDN links are available for these resources (see [statgen.github.io/locuszoom/](http://statgen.github.io/locuszoom/)).\n\n### 2. Define Data Sources\n\n**Data Sources** is an object representing a collection of arbitrarily many sources from which data for the plot can \nbe requested. When adding sources to the collection they must be namespaced so that retrieving specific fields can be \ndone with respect to specific data sources.\n\nHere's an example of defining a data sources object for a remote API:\n\n```javascript\nvar data_sources = new LocusZoom.DataSources();\ndata_sources.add(\"trait\", [\"AssociationLZ\", { url: \"http://server.com/api/\" }]);\n```\n\nThe above example adds an \"AssociationLZ\" data source (a predefined data source designed to make requests for \nassociation data) with a defined URL. The namespace for this data source is \"trait\".\n\nData sources can also be local files:\n\n```javascript\ndata_sources = new LocusZoom.DataSources();\ndata_sources.add(\"trait\", [\"AssociationLZ\", { url: \"file:///path/to/data.json\" }]);\n```\n\nRefer to the [Data Sources Documentation](https://github.com/statgen/locuszoom/wiki/Data-Sources) for more information \non using predefined data sources or extending/creating custom data sources.\n\n### 3. Define a Layout\n\n**Layout** is a serializable object that describes the configuration of the LocusZoom plot, including what data will be\n pulled from the data sources and displayed in what way, along with visual characteristics like color and geometry.\n\nA layout definition may look something like this:\n\n```javascript\nvar layout = {\n width: 500,\n height: 500,\n panels: [\n {\n id: \"association\",\n data_layers: [\n {\n id: \"association\",\n type: \"scatter\",\n fields: [\"trait:position\", \"trait:pvalue\"],\n x_axis: { field: \"trait:position\" },\n y_axis: { field: \"trait:pvalue\" }\n }\n ]\n }\n ]\n};\n```\n\nThe above example defines a basic plot that is 500 pixels on a side and has one panel with one scatter plot data layer\n that pulls in position and pvalue from the \"trait\" data source, mapping position to the x axis and pvalue to the y axis.\n\nThe LocusZoom.js library provides several pre-defined layouts for entire plots and subdivisions of plots such as panels,\n data layers, tool tips, etc. Refer to the [Layout Documentation](https://github.com/statgen/locuszoom/wiki/Layout) \n for more information.\n\n### 4. Put it Together with `LocusZoom.populate()`\n\nWith includes included, data sources defined, and a layout defined, `LocusZoom.populate()` will accept a CSS selector \nstring to populate the first matching element with a plot.\n\nA basic example may then look like this:\n\n```html\n\n \n \n \n \n \n \n \n \n \n\n```\n\n### Other Ways To Make a LocusZoom Plot\n\n#### Use a Predefined Layout\n\nThe core LocusZoom library comes equipped with several predefined layouts, organized by type (\"plot\", \"panel\", \n\"data_layer\", and \"dashboard\"). You can see what layouts are predefined by reading the contents of \n`assets/js/app/Layouts.js` or in the browser by entering `LocusZoom.Layouts.list()` (or to list one specific type: \n`LocusZoom.Layouts.list(type)`).\n\nGet any predefined layout by type and name using `LocusZoom.Layouts.get(type, name)`.\n \nIf no layout is passed to `LocusZoom.populate()` the Standard GWAS plot layout is used (requiring appropriate data \nsources to be configured).\n\n#### Build a Layout Using Some Predefined Pieces\n\n`LocusZoom.Layouts.get(type, name)` can also be used to pull predefined layouts of smaller pieces, like data layers or \ndashboards, into a custom layout:\n\n```javascript\nvar layout = {\n width: 1000,\n height: 500,\n panels: [\n LocusZoom.Layouts.get(\"panel\",\"gwas\"),\n {\n id: \"custom_panel\",\n ...\n },\n LocusZoom.Layouts.get(\"panel\",\"genes\")\n ]\n ...\n};\n```\n\n#### Modify a Predefined Layout\n\nThe `get()` function also accepts a partial layout to be merged with the predefined layout as a third argument, \nproviding the ability to use predefined layouts as starting points for custom layouts with only minor differences. Example:\n\n```javascript\nvar changes = {\n label_font_size: 20,\n transition: false\n};\nLocusZoom.Layouts.get(\"data_layer\", \"genes\", changes);\n```\n\n#### Predefining State by Building a State Object\n\n**State** is a serializable JSON object that describes orientation to specific data from data sources, and specific \ninteractions with the layout. This can include a specific query against various data sources or pre-selecting specific\n elements. Essentially, the state object is what tracks these types of user input under the hood in LocusZoom, and it \n can be predefined at initialization as a top-level parameter in the layout. For example:\n\n```javascript\nvar layout = LocusZoom.Layouts.merge({ state: { chr: 6, start: 20379709, end: 20979709 } }, LocusZoom.StandardLayout);\n```\n\n#### Predefining State With `data-region`\n\nYou can also describe the locus query aspect of the State (chromosome, start, and end position) using a `data-region`\n attribute of the containing element before populating it, like so:\n\n```html\n\n```\n\nWhen `LocusZoom.populate()` is executed on the element defined above it will automatically parse any `data-region` \nparameter to convert those values into the initial state.\n\n#### Making Many LocusZoom Plots at Once\n\n`LocusZoom.populate()` will only populate the first matching HTML element for the provided selector string. To populate \nall matching elements for a single selector string use `LocusZoom.populateAll()` like so:\n\n```html\n\n\n\n\n```\n\n## Development Setup\n\n### Dependencies\n\nLocusZoom is an entirely client-side application designed to plug into arbitrary data sets, be they local files, APIs,\n or something else entirely. It has the following vendor dependencies:\n\n* [d3](http://d3js.org/) for a data visualization framework\n\n### Build System and Automated Testing\n\nThe application is built using [Gulp](http://gulpjs.com/). Gulp and all necessary dev dependencies can be installed for\n this project from the top-level directory using the following commands:\n\n```\n$ npm install\n```\n\nOnce complete run `npx gulp build` from the top of the application directory to run all tests and build the \nfollowing files (in the `dist` folder):\n\n* `locuszoom.app.js` - A concatenated app file suitable for use in development\n* `locuszoom.app.min.js` - A concatenated and minified app file suitable for use in production\n* `locuszoom.vendor.min.js` - A concatenated vendor file suitable for use as a single vendor include in either \ndevelopment or production (contains d3)\n* `locuszoom.css` - A generated CSS file for all LocusZoom styles\n\nThis build process will also write sourcemaps, to help with debugging code even in production environments.\n\n#### Other supported gulp commands:\n* `npx gulp build` - Build app and vendor js files (runs tests and aborts if tests fail)\n* `npx gulp watch` - Watch for any changes to app .js, .scss, or test source files to trigger another full build\n* `npx gulp test` - Just run the tests\n* `npx gulp app_js` - Build app js files (does not run tests)\n* `npx gulp ext_js` - Build extensions (features that are not part of LocusZoom core)\n* `npx gulp vendor_js` - Build vendor js file\n* `npx gulp css` - Build CSS file\n\n#### The `--force` Flag\n\nAppend `--force` to the end of any gulp command that runs the automated testing suite to force the creation of \n`locuszoom.app.js` and `locuszoom.app.min.js` **even when the tests fail**. This can be useful during active \ndevelopment as sometimes debugging can be led from either the output of automated tests or inspection of \nan active plugin.\n\nThis flag is particularly useful with the watch command:\n\n`$ npx gulp watch --force`\n\nThe above command with enter forced-watch-mode, which will detect any changes to app .js or .scss files, as well as \ntest files, and run a new build. If errors are encountered in the tests they will be reported, but `locuszoom.app.js`\n and `locuszoom.app.min.js` will still be generated and gulp will not exit but return to watch mode. **This is an \n effective way to have automatic continuous builds while developing both the application and its tests.**\n\n#### Automated Testing\n\nLocusZoom uses [Mocha](https://mochajs.org/) for unit testing. Tests are located in the `test` subdirectory, with \na one-to-one mapping of test files to app files.\n\n**Note that the build and test process requires Node.js version 6 LTS or higher.**\n\n### Linting and Strict Mode\n\nAll app-specific javascript files should be developed in **strict mode**. LocusZoom is also linted using \n[ESLint](http://eslint.org/), the rules for which can be found in `.eslintrc`.\n\n## Help and Support\n\nFull documentation can be found here: [github.com/statgen/locuszoom/wiki](https://github.com/statgen/locuszoom/wiki)\n\nA LocusZoom discussion forum is available here: [groups.google.com/forum/#!forum/locuszoom](https://groups.google.com/forum/#!forum/locuszoom). \nFor the most effective help, please specify that your question is about \"LocusZoom.js\".\n\nIf you have questions or feedback please file an issue on the [LocusZoom.js GitHub repository](https://github.com/statgen/locuszoom/issues) or post at the discussion forum referenced above.\n","readmeFilename":"README.md","gitHead":"f72c2a9be8c51bfc21a2053e757f53784d7386a2","bugs":{"url":"https://github.com/statgen/locuszoom/issues"},"_id":"locuszoom@0.10.0-beta.1","_npmVersion":"6.4.1","_nodeVersion":"8.16.0","_npmUser":{"name":"abought","email":"abought@gmail.com"},"dist":{"integrity":"sha512-WCfR5L9hUu132SfqaZyTW7Ld8ScO0c47gMEez3V/7Tiesr/Q2uoyU76ZrfSGHRxY7q08z66lAVH12CA2u7LJng==","shasum":"bb98b0ca1686ec9f6e61018f104bb938c7e6ca37","tarball":"https://registry.npmjs.org/locuszoom/-/locuszoom-0.10.0-beta.1.tgz","fileCount":90,"unpackedSize":7219580,"npm-signature":"-----BEGIN PGP SIGNATURE-----\r\nVersion: OpenPGP.js v3.0.4\r\nComment: https://openpgpjs.org\r\n\r\nwsFcBAEBCAAQBQJdm4l6CRA9TVsSAnZWagAAntMP/REuxxOGKUdhlBdxYon9\nZq7o5CfRaslyaPgOmVqZ5ic/JxciR0b8zgAxAI7U93JvKM3kkN3k/H/37k00\nQvH+2EN47cSsQu1dtZPvPPQteutFytUHEltVzihG8ccap6+43R5c/4G6Wu4/\niS4Gz/foRBo3BIfszf9KMwNC9B0EsVBcy36j1an0jbV+sHU2E+o6YEEf5EBb\nolQX235NYXSDvo3rRGuK0VqlGOpivIM2o8iD2z+K7rrYLigiKdAcekBd5EO/\nR/fOKTa5OKGJLP90LsyyVAQvIiwuJVCicUD6otHwqX6x3aCtE3SVo7JYWd7p\nrYY3gObOV1/q1TJ5wSBwiekN2rXx+/Di+sigFx2fpBLLpgenbPaY6gCSGEmG\nI3jOf/j1WtPok88qYnA5EJl+MOafbQ9P65YzLMaExDY1AKisNKWm/sfevOMD\nx7iRziiaRhyoBb+eHeVvIiWQavTpNh3ReBPuz3SJ9DbfQ4Xp37gVqEUwKxec\nmm4Slwohz7Y4SMc0/O27RdbeP7hOqqceKNhXAhPJd7tHreFX7ZPjgftY5EMT\n7TdGWKVwwHm5Eu29YYW533wRce1T/Il0vmv4odokA0lg9LUBPMZmwU46Y6aj\ny0t7mb67VWjGZZkb/Oi5Wt+nWyGeywF/HHWPoWPNhWEWibjeqDToWoWQBH+Z\nzzEp\r\n=nBYd\r\n-----END PGP SIGNATURE-----\r\n","signatures":[{"keyid":"SHA256:jl3bwswu80PjjokCgh0o2w5c2U4LhQAE57gj9cz1kzA","sig":"MEYCIQD3k3GiKi4dQlRI5ez9bwtMWNkN6azg21E1syVSiRKCCgIhAKQta0YMebGkVagy/mw19FbKuQWnGDlGNyaNYGGjkmHw"}]},"maintainers":[{"name":"abought","email":"abought@gmail.com"},{"name":"frencil","email":"frencils@gmail.com"}],"directories":{},"_npmOperationalInternal":{"host":"s3://npm-registry-packages","tmp":"tmp/locuszoom_0.10.0-beta.1_1570474361539_0.05458142267536692"},"_hasShrinkwrap":false},"0.10.0-beta.2":{"name":"locuszoom","version":"0.10.0-beta.2","description":"Generate interactive visualizations of statistical genetic data","keywords":["visualization","genetics","genes","gwas","phewas"],"homepage":"http://locuszoom.org","license":"MIT","author":{"name":"Christopher Clark","email":"chriclrk@umich.edu"},"contributors":[{"name":"Matthew Flickinger"},{"name":"Ryan Welch"},{"name":"Peter VandeHaar"},{"name":"Andy Boughton","email":"abought@umich.edu"}],"main":"dist/locuszoom.app.min.js","engines":{"node":">=6.12.0"},"repository":{"type":"git","url":"git+https://github.com/statgen/locuszoom.git"},"scripts":{"build":"gulp build","test":"gulp test","lint":"gulp lint","watch":"gulp watch"},"dependencies":{"d3":"3.5.17","promise-polyfill":"^8.1.3"},"devDependencies":{"del":"~3.0.0","eslint":"^5.16.0","glob":"^7.1.3","gulp":"^4.0.0","gulp-concat":"~2.6.1","gulp-eslint":"~5.0.0","gulp-filter":"^5.1.0","gulp-mocha":"~6.0.0","gulp-rename":"~1.4.0","gulp-sass":"~4.0.2","gulp-sourcemaps":"~2.6.4","gulp-uglify":"~3.0.1","gulp-util":"~3.0.8","gulp-watch":"~5.0.1","gulp-wrap-js":"~0.4.1","jsdoc":"^3.6.3","jsdom":"~9.12.0","mocha":"~5.2.0","mocha-jsdom":"~2.0.0","should":"^13.2.3","sinon":"^6.1.6","yargs":"^12.0.2"},"readme":"# LocusZoom\n\nLocusZoom is a Javascript/d3 embeddable plugin for interactively visualizing statistical genetic data from customizable\n sources.\n\n[](https://api.travis-ci.org/statgen/locuszoom)\n\nSee [github.com/statgen/locuszoom/wiki](https://github.com/statgen/locuszoom/wiki) for full documentation and API reference.\n\nTo see functional examples of plots generated with LocusZoom.js see [statgen.github.io/locuszoom](http://statgen.github.io/locuszoom/) \nand [statgen.github.io/locuszoom/#examples](http://statgen.github.io/locuszoom/#examples).\n\n\n\n## Making a LocusZoom Plot\n\n### 1. Include Necessary JavaScript and CSS\n\nThe page you build that embeds the LocusZoom plugin must include the following resources, found in the `dist` directory:\n\n* `locuszoom.vendor.min.js` \n This file contains the concatenated vendor libraries. You can alternatively include [d3](http://d3js.org/)\n from other sources, so long as it is included **before including LocusZoom files**. This bundle also contains a \n polyfill for ES6 `Promise`, which you may need if your site supports certain older browsers such as Internet Explorer.\n\n* `locuszoom.app.js` OR `locuszoom.app.min.js` \n This is the primary application logic. It should only be included *after* the vendor dependencies have been included. \n\n* `locuszoom.css` \n This is the primary stylesheet. It is namespaced so as not to conflict with any other styles defined on the same page.\n\nCDN links are available for these resources (see [statgen.github.io/locuszoom/](http://statgen.github.io/locuszoom/)).\n\n### 2. Define Data Sources\n\n**Data Sources** is an object representing a collection of arbitrarily many sources from which data for the plot can \nbe requested. When adding sources to the collection they must be namespaced so that retrieving specific fields can be \ndone with respect to specific data sources.\n\nHere's an example of defining a data sources object for a remote API:\n\n```javascript\nvar data_sources = new LocusZoom.DataSources();\ndata_sources.add(\"trait\", [\"AssociationLZ\", { url: \"http://server.com/api/\" }]);\n```\n\nThe above example adds an \"AssociationLZ\" data source (a predefined data source designed to make requests for \nassociation data) with a defined URL. The namespace for this data source is \"trait\".\n\nData sources can also be local files:\n\n```javascript\ndata_sources = new LocusZoom.DataSources();\ndata_sources.add(\"trait\", [\"AssociationLZ\", { url: \"file:///path/to/data.json\" }]);\n```\n\nRefer to the [Data Sources Documentation](https://github.com/statgen/locuszoom/wiki/Data-Sources) for more information \non using predefined data sources or extending/creating custom data sources.\n\n### 3. Define a Layout\n\n**Layout** is a serializable object that describes the configuration of the LocusZoom plot, including what data will be\n pulled from the data sources and displayed in what way, along with visual characteristics like color and geometry.\n\nA layout definition may look something like this:\n\n```javascript\nvar layout = {\n width: 500,\n height: 500,\n panels: [\n {\n id: \"association\",\n data_layers: [\n {\n id: \"association\",\n type: \"scatter\",\n fields: [\"trait:position\", \"trait:pvalue\"],\n x_axis: { field: \"trait:position\" },\n y_axis: { field: \"trait:pvalue\" }\n }\n ]\n }\n ]\n};\n```\n\nThe above example defines a basic plot that is 500 pixels on a side and has one panel with one scatter plot data layer\n that pulls in position and pvalue from the \"trait\" data source, mapping position to the x axis and pvalue to the y axis.\n\nThe LocusZoom.js library provides several pre-defined layouts for entire plots and subdivisions of plots such as panels,\n data layers, tool tips, etc. Refer to the [Layout Documentation](https://github.com/statgen/locuszoom/wiki/Layout) \n for more information.\n\n### 4. Put it Together with `LocusZoom.populate()`\n\nWith includes included, data sources defined, and a layout defined, `LocusZoom.populate()` will accept a CSS selector \nstring to populate the first matching element with a plot.\n\nA basic example may then look like this:\n\n```html\n\n \n \n \n \n \n \n \n \n \n\n```\n\n### Other Ways To Make a LocusZoom Plot\n\n#### Use a Predefined Layout\n\nThe core LocusZoom library comes equipped with several predefined layouts, organized by type (\"plot\", \"panel\", \n\"data_layer\", and \"dashboard\"). You can see what layouts are predefined by reading the contents of \n`assets/js/app/Layouts.js` or in the browser by entering `LocusZoom.Layouts.list()` (or to list one specific type: \n`LocusZoom.Layouts.list(type)`).\n\nGet any predefined layout by type and name using `LocusZoom.Layouts.get(type, name)`.\n \nIf no layout is passed to `LocusZoom.populate()` the Standard GWAS plot layout is used (requiring appropriate data \nsources to be configured).\n\n#### Build a Layout Using Some Predefined Pieces\n\n`LocusZoom.Layouts.get(type, name)` can also be used to pull predefined layouts of smaller pieces, like data layers or \ndashboards, into a custom layout:\n\n```javascript\nvar layout = {\n width: 1000,\n height: 500,\n panels: [\n LocusZoom.Layouts.get(\"panel\",\"gwas\"),\n {\n id: \"custom_panel\",\n ...\n },\n LocusZoom.Layouts.get(\"panel\",\"genes\")\n ]\n ...\n};\n```\n\n#### Modify a Predefined Layout\n\nThe `get()` function also accepts a partial layout to be merged with the predefined layout as a third argument, \nproviding the ability to use predefined layouts as starting points for custom layouts with only minor differences. Example:\n\n```javascript\nvar changes = {\n label_font_size: 20,\n transition: false\n};\nLocusZoom.Layouts.get(\"data_layer\", \"genes\", changes);\n```\n\n#### Predefining State by Building a State Object\n\n**State** is a serializable JSON object that describes orientation to specific data from data sources, and specific \ninteractions with the layout. This can include a specific query against various data sources or pre-selecting specific\n elements. Essentially, the state object is what tracks these types of user input under the hood in LocusZoom, and it \n can be predefined at initialization as a top-level parameter in the layout. For example:\n\n```javascript\nvar layout = LocusZoom.Layouts.merge({ state: { chr: 6, start: 20379709, end: 20979709 } }, LocusZoom.StandardLayout);\n```\n\n#### Predefining State With `data-region`\n\nYou can also describe the locus query aspect of the State (chromosome, start, and end position) using a `data-region`\n attribute of the containing element before populating it, like so:\n\n```html\n\n```\n\nWhen `LocusZoom.populate()` is executed on the element defined above it will automatically parse any `data-region` \nparameter to convert those values into the initial state.\n\n#### Making Many LocusZoom Plots at Once\n\n`LocusZoom.populate()` will only populate the first matching HTML element for the provided selector string. To populate \nall matching elements for a single selector string use `LocusZoom.populateAll()` like so:\n\n```html\n\n\n\n\n```\n\n## Development Setup\n\n### Dependencies\n\nLocusZoom is an entirely client-side application designed to plug into arbitrary data sets, be they local files, APIs,\n or something else entirely. It has the following vendor dependencies:\n\n* [d3](http://d3js.org/) for a data visualization framework\n\n### Build System and Automated Testing\n\nThe application is built using [Gulp](http://gulpjs.com/). Gulp and all necessary dev dependencies can be installed for\n this project from the top-level directory using the following commands:\n\n```\n$ npm install\n```\n\nOnce complete run `npx gulp build` from the top of the application directory to run all tests and build the \nfollowing files (in the `dist` folder):\n\n* `locuszoom.app.js` - A concatenated app file suitable for use in development\n* `locuszoom.app.min.js` - A concatenated and minified app file suitable for use in production\n* `locuszoom.vendor.min.js` - A concatenated vendor file suitable for use as a single vendor include in either \ndevelopment or production (contains d3)\n* `locuszoom.css` - A generated CSS file for all LocusZoom styles\n\nThis build process will also write sourcemaps, to help with debugging code even in production environments.\n\n#### Other supported gulp commands:\n* `npx gulp build` - Build app and vendor js files (runs tests and aborts if tests fail)\n* `npx gulp watch` - Watch for any changes to app .js, .scss, or test source files to trigger another full build\n* `npx gulp test` - Just run the tests\n* `npx gulp app_js` - Build app js files (does not run tests)\n* `npx gulp ext_js` - Build extensions (features that are not part of LocusZoom core)\n* `npx gulp vendor_js` - Build vendor js file\n* `npx gulp css` - Build CSS file\n\n#### The `--force` Flag\n\nAppend `--force` to the end of any gulp command that runs the automated testing suite to force the creation of \n`locuszoom.app.js` and `locuszoom.app.min.js` **even when the tests fail**. This can be useful during active \ndevelopment as sometimes debugging can be led from either the output of automated tests or inspection of \nan active plugin.\n\nThis flag is particularly useful with the watch command:\n\n`$ npx gulp watch --force`\n\nThe above command with enter forced-watch-mode, which will detect any changes to app .js or .scss files, as well as \ntest files, and run a new build. If errors are encountered in the tests they will be reported, but `locuszoom.app.js`\n and `locuszoom.app.min.js` will still be generated and gulp will not exit but return to watch mode. **This is an \n effective way to have automatic continuous builds while developing both the application and its tests.**\n\n#### Automated Testing\n\nLocusZoom uses [Mocha](https://mochajs.org/) for unit testing. Tests are located in the `test` subdirectory, with \na one-to-one mapping of test files to app files.\n\n**Note that the build and test process requires Node.js version 6 LTS or higher.**\n\n### Linting and Strict Mode\n\nAll app-specific javascript files should be developed in **strict mode**. LocusZoom is also linted using \n[ESLint](http://eslint.org/), the rules for which can be found in `.eslintrc`.\n\n## Help and Support\n\nFull documentation can be found here: [github.com/statgen/locuszoom/wiki](https://github.com/statgen/locuszoom/wiki)\n\nA LocusZoom discussion forum is available here: [groups.google.com/forum/#!forum/locuszoom](https://groups.google.com/forum/#!forum/locuszoom). \nFor the most effective help, please specify that your question is about \"LocusZoom.js\".\n\nIf you have questions or feedback please file an issue on the [LocusZoom.js GitHub repository](https://github.com/statgen/locuszoom/issues) or post at the discussion forum referenced above.\n","readmeFilename":"README.md","gitHead":"90d1efad526120bc573d3391fcbd73db9c14d54a","bugs":{"url":"https://github.com/statgen/locuszoom/issues"},"_id":"locuszoom@0.10.0-beta.2","_npmVersion":"6.4.1","_nodeVersion":"8.16.0","_npmUser":{"name":"abought","email":"abought@gmail.com"},"dist":{"integrity":"sha512-SkyquD7OCPJQcCrFoJxHBlA9/U9CNJb+EE1n+O/jnX5CqiFlPUHHrzi8KzBUPZ25DQHdtCHXM7YE+0imHTrYDg==","shasum":"7c007c421ee3c1e39f9adab6612874761bb455c6","tarball":"https://registry.npmjs.org/locuszoom/-/locuszoom-0.10.0-beta.2.tgz","fileCount":181,"unpackedSize":15925155,"npm-signature":"-----BEGIN PGP SIGNATURE-----\r\nVersion: OpenPGP.js v3.0.4\r\nComment: https://openpgpjs.org\r\n\r\nwsFcBAEBCAAQBQJdybG6CRA9TVsSAnZWagAAkDoP+wXgmWyhHc+RMRZJ8vV5\nuEzMnoSbwX36evMHMI2zFZe4KwSj6hPmnrrOUuCIZK+3l79m5i7VIqquK1FH\nFRE/Bx7MkosnWf4Cw2X2vmOlY1SQZKgUoFTcFF4K3SlesX6ZWJM768VeOyXP\nduJS54S5U+owgHydvYgVhTgMf4lMjficzCqAN8o2ONIzC9kAJ/KxFa33PjEX\nKNXP0iUgWNIhYkCcOuyiq6WNQgBZR/V9K6rGCLkwcqXTem+sfUkZ1xwbLCu8\nByL6AlQBTtBvl86MY+UT1tE6edi58Efiw+sY68VU9nPoggYujg+AseHe2arX\nLjoyr2rHAjyMdFLkMI6Akc4UMNCMnXNU/isoYCuvpaCmx9BrdGff0Kj6pUeO\nQF6fYWHQ7EQnqc+HmH1XhwPIvuw/Mful9799++IXNweccASTjhd8rK+UbbHh\n6Iy3j1zaHBxkAbDAlU4XCleBPK29k7yFCJuAJSA9WXgBeJeWEEp3/gnSEL8J\nuACYCKSl5aP/MpmffPBgN3Cj7v2tpnf/qYqTnOQzQZxazJ5CfjOaBIXROcXb\nvzVeRhMWyH6CQvVc20CvXoA9iFIoFpU1GbFN/aGRRriRPKr6rsa0+6dnE9rA\nJ7YbqPvo3JTrzpQyivVbtxpK4BU3XTLrUtuS2tiMHdf1d16t8xSjphXHOe4z\nSVuk\r\n=NrED\r\n-----END PGP SIGNATURE-----\r\n","signatures":[{"keyid":"SHA256:jl3bwswu80PjjokCgh0o2w5c2U4LhQAE57gj9cz1kzA","sig":"MEQCH1MOMSHYPqVOrpoUtq4ZeuwXEzhmaA0e3dRd99rp3c4CIQDjJzq/y5lFXRxjbRq809hoKLuxin2+1mZlhr0tywrFYg=="}]},"maintainers":[{"name":"abought","email":"abought@gmail.com"},{"name":"frencil","email":"frencils@gmail.com"}],"directories":{},"_npmOperationalInternal":{"host":"s3://npm-registry-packages","tmp":"tmp/locuszoom_0.10.0-beta.2_1573499322075_0.560344005030438"},"_hasShrinkwrap":false},"0.10.0":{"name":"locuszoom","version":"0.10.0","description":"Generate interactive visualizations of statistical genetic data","keywords":["visualization","genetics","genes","gwas","phewas"],"homepage":"http://locuszoom.org","license":"MIT","author":{"name":"Christopher Clark","email":"chriclrk@umich.edu"},"contributors":[{"name":"Matthew Flickinger"},{"name":"Ryan Welch"},{"name":"Peter VandeHaar"},{"name":"Andy Boughton","email":"abought@umich.edu"}],"main":"dist/locuszoom.app.min.js","engines":{"node":">=10.17.0"},"repository":{"type":"git","url":"git+https://github.com/statgen/locuszoom.git"},"scripts":{"build":"gulp build","test":"gulp test","lint":"gulp lint","watch":"gulp watch"},"dependencies":{"d3":"3.5.17","promise-polyfill":"^8.1.3"},"devDependencies":{"del":"~3.0.0","eslint":"^5.16.0","glob":"^7.1.3","gulp":"^4.0.0","gulp-concat":"~2.6.1","gulp-eslint":"~5.0.0","gulp-filter":"^5.1.0","gulp-mocha":"~6.0.0","gulp-rename":"~1.4.0","gulp-sass":"~4.0.2","gulp-sourcemaps":"~2.6.4","gulp-uglify":"~3.0.1","gulp-util":"~3.0.8","gulp-watch":"~5.0.1","gulp-wrap-js":"~0.4.1","jsdoc":"^3.6.3","jsdom":"~9.12.0","mocha":"~5.2.0","mocha-jsdom":"~2.0.0","should":"^13.2.3","sinon":"^6.1.6","yargs":"^12.0.2"},"gitHead":"ef6642878ca2c9ec63809a68abd07ccaf43e0ca1","bugs":{"url":"https://github.com/statgen/locuszoom/issues"},"_id":"locuszoom@0.10.0","_nodeVersion":"12.13.1","_npmVersion":"6.12.1","dist":{"integrity":"sha512-v+g8YKHszmZL7/yJg5EDZhrGS3jlGoP/WTXM0WFjTUi8MrPCADaeutwx/FhkmZtbhtlb+khO+8EYItaaTGEMLg==","shasum":"7dad2341af6e539f6bbf0878ec1753a521e7c647","tarball":"https://registry.npmjs.org/locuszoom/-/locuszoom-0.10.0.tgz","fileCount":89,"unpackedSize":7270045,"npm-signature":"-----BEGIN PGP SIGNATURE-----\r\nVersion: OpenPGP.js v3.0.4\r\nComment: https://openpgpjs.org\r\n\r\nwsFcBAEBCAAQBQJd8rVrCRA9TVsSAnZWagAAOA0QAJKXQTSTWygRdwzxN/my\npbZWcVh7tWJTnrRacTXTu7I6nDDXxK3JOuPuqNVJGNlG1fsQLCPS9sJubtyq\nrUQpBZJF3+XDVJuOPWUwLlHLHVSlvlJYLurYH+gqwYWwio3atg1LodGBt1yF\nZ5+6qit+r/owpF2xwicy+4MfB/U8SVIbRE35PgpBvxvTvSTEpJJIoioxpZYI\nYYRS+VbyXue0JP6XRCnNTgmRBjFxDvnJVKqffDQv39bKJg/KibOmKp5ErZvV\nkKc83+chFDmYNvMYMw6JE0d2qP+xAd35MuR4QC6oel5Ipiau/ME8lI/BxoJw\nl9G9Qx9+pVBLvcxXFLWGPWIkqdMmlLfRzy4V3xGeBYOeJZyyr0qEc6GnW14Q\nzXipow7vmjAiHqOAaKunFtouQaHIQcCAGrjAwHTkRHgMZcrrMugiSl5VKZl0\nw5x1PgMIFuimRMJ7Nvy9ZAm1jVCwpy69T0as9pXRBUWidoItDxtn1Rj7Hlgk\n95SrXa+S9sqeuypdBqoXJDeMDekb1dRJ9eof8Zto9PEH9VklrPcsWhrzptYo\ntKRFx8ErBm0p9OUvqis0R6kE0lCP+R/HMUj5KYq8XN1J5V+HFxKCAFuuMRcf\nHRO9zSeVl+fFIYBgL72vzghveF+5h6jN/aPYu3Pe3ptdj7hGQCKtkUwEHX3Z\ntX8i\r\n=T9i3\r\n-----END PGP SIGNATURE-----\r\n","signatures":[{"keyid":"SHA256:jl3bwswu80PjjokCgh0o2w5c2U4LhQAE57gj9cz1kzA","sig":"MEYCIQCAVJK8EK6DmrwLXCVAnAuX2ya7J5vJ/v9d5cmewrRKowIhAPL6lM3VHvuP6FnqPtgviZHENsCAiTMduNcXXg8522Ch"}]},"maintainers":[{"name":"abought","email":"abought@gmail.com"},{"name":"frencil","email":"frencils@gmail.com"}],"_npmUser":{"name":"abought","email":"abought@gmail.com"},"directories":{},"_npmOperationalInternal":{"host":"s3://npm-registry-packages","tmp":"tmp/locuszoom_0.10.0_1576187242926_0.42003959124078394"},"_hasShrinkwrap":false},"0.10.1":{"name":"locuszoom","version":"0.10.1","description":"Generate interactive visualizations of statistical genetic data","keywords":["visualization","genetics","genes","gwas","phewas"],"homepage":"http://locuszoom.org","license":"MIT","author":{"name":"Christopher Clark","email":"chriclrk@umich.edu"},"contributors":[{"name":"Matthew Flickinger"},{"name":"Ryan Welch"},{"name":"Peter VandeHaar"},{"name":"Andy Boughton","email":"abought@umich.edu"}],"main":"dist/locuszoom.app.min.js","engines":{"node":">=8.9.0"},"repository":{"type":"git","url":"git+https://github.com/statgen/locuszoom.git"},"scripts":{"build":"gulp build","test":"gulp test","lint":"gulp lint","watch":"gulp watch"},"dependencies":{"d3":"3.5.17","promise-polyfill":"^8.1.3"},"devDependencies":{"del":"~3.0.0","eslint":"^5.16.0","glob":"^7.1.3","gulp":"^4.0.0","gulp-concat":"~2.6.1","gulp-eslint":"~5.0.0","gulp-filter":"^5.1.0","gulp-mocha":"~6.0.0","gulp-rename":"~1.4.0","gulp-sass":"~4.0.2","gulp-sourcemaps":"~2.6.4","gulp-uglify":"~3.0.1","gulp-util":"~3.0.8","gulp-watch":"~5.0.1","gulp-wrap-js":"~0.4.1","jsdoc":"^3.6.3","jsdom":"~9.12.0","mocha":"~5.2.0","mocha-jsdom":"~2.0.0","should":"^13.2.3","sinon":"^6.1.6","yargs":"^12.0.2"},"gitHead":"e3c5f8bb9f20d7c0bed593116da56810f6927b45","bugs":{"url":"https://github.com/statgen/locuszoom/issues"},"_id":"locuszoom@0.10.1","_nodeVersion":"12.13.1","_npmVersion":"6.12.1","dist":{"integrity":"sha512-ASMZ+1Y0dBgclZgSs1PFm1Sfbk/CWPv2WNPVosDtN7ejDxwVMiiCB/99ZtBUEDhsILu05epA0NRjvp4V8AWMHw==","shasum":"dadd71dadbcb309de0aaa9209e11a1c1d7d5f0f9","tarball":"https://registry.npmjs.org/locuszoom/-/locuszoom-0.10.1.tgz","fileCount":90,"unpackedSize":7282826,"npm-signature":"-----BEGIN PGP SIGNATURE-----\r\nVersion: OpenPGP.js v3.0.4\r\nComment: https://openpgpjs.org\r\n\r\nwsFcBAEBCAAQBQJeH0siCRA9TVsSAnZWagAAxtcP/if9cY+NmNERjjfyDz28\nGGp8J8G/CFfhJldUiFCNX/v4w2rnS5hs7CELsy4snNdo01TGLb+KS8vYDGGO\n493iZZr9OgALOaU3VFRn/R3JyvUMh6PpUYftJD4leWyGQ9Hgr6mEgZLc6hme\nYDQfFZHRiuOHokWF1oej11YP35teiAH5Q3UNjabhag6P2A31LSynyoO+Cxir\nXDdZonPJtDlCjI0H744uu7fF7bjm9+MswlJqxcczerMb9hXevccyKQst66PY\na9vKhb/6Bv7XFGQRYcidEVLCNsJCVKtbPbhxYsOxAOgPYtFmIAuRc5NT04TC\nO+iCt33/IYmomCHRjyqRtDvyPMRBr35wnwye5YggXfTfvIn4Y5C31DVzDpav\nBiaC0cK2XdclxiiFSZOEVpoEKUg9IG9/7Z5g+Bn+FYNUifIE8DG22Kh93o19\nuFsToVCdb6Unw6fyY+czAIVayU9PVuh6F/BiM5uuUaQuyIWVpZRDoT07ahmW\n/gJ6Y5wTu678BzVSZFT0HDiB30Go3iWsPDoMOqUnaryCpKb3pB6g50G+M8xU\ntBaDjC1oHM7bo5Bq1qY1O+n+zpPzoBYjCyfp4Ky/Ko2Oqbeb1JKeFBogXx59\n2/Ry8iPL+BNKQ1ODDmwPBtJqG+HBrKjd5NASf0pesjHFlT6HjKUevqKRamB7\nOOE4\r\n=Zb7u\r\n-----END PGP SIGNATURE-----\r\n","signatures":[{"keyid":"SHA256:jl3bwswu80PjjokCgh0o2w5c2U4LhQAE57gj9cz1kzA","sig":"MEQCIA1uEs6wwBS6BMVizbmdLEJpK7qvLuDAgIe2MENryoTTAiBQXDbK8IP8Ji4DMVbF33bU8FMeKlE0WsJqjj9hUcIeqQ=="}]},"maintainers":[{"name":"abought","email":"abought@gmail.com"},{"name":"frencil","email":"frencils@gmail.com"}],"_npmUser":{"name":"abought","email":"abought@gmail.com"},"directories":{},"_npmOperationalInternal":{"host":"s3://npm-registry-packages","tmp":"tmp/locuszoom_0.10.1_1579109153540_0.3604647943159094"},"_hasShrinkwrap":false},"0.10.2":{"name":"locuszoom","version":"0.10.2","description":"Generate interactive visualizations of statistical genetic data","keywords":["visualization","genetics","genes","gwas","phewas"],"homepage":"http://locuszoom.org","license":"MIT","author":{"name":"Christopher Clark","email":"chriclrk@umich.edu"},"contributors":[{"name":"Matthew Flickinger"},{"name":"Ryan Welch"},{"name":"Peter VandeHaar"},{"name":"Andy Boughton","email":"abought@umich.edu"}],"main":"dist/locuszoom.app.min.js","engines":{"node":">=8.9.0"},"repository":{"type":"git","url":"git+https://github.com/statgen/locuszoom.git"},"scripts":{"build":"gulp build","test":"gulp test","lint":"gulp lint","watch":"gulp watch"},"dependencies":{"d3":"3.5.17","promise-polyfill":"^8.1.3"},"devDependencies":{"del":"~3.0.0","eslint":"^5.16.0","glob":"^7.1.3","gulp":"^4.0.0","gulp-concat":"~2.6.1","gulp-eslint":"~5.0.0","gulp-filter":"^5.1.0","gulp-mocha":"~6.0.0","gulp-rename":"~1.4.0","gulp-sass":"~4.0.2","gulp-sourcemaps":"~2.6.4","gulp-uglify":"~3.0.1","gulp-util":"~3.0.8","gulp-watch":"~5.0.1","gulp-wrap-js":"~0.4.1","jsdoc":"^3.6.3","jsdom":"~9.12.0","mocha":"~5.2.0","mocha-jsdom":"~2.0.0","should":"^13.2.3","sinon":"^6.1.6","yargs":"^12.0.2"},"gitHead":"bc231806861f59d17aa7f71ae3434d449a0c7829","bugs":{"url":"https://github.com/statgen/locuszoom/issues"},"_id":"locuszoom@0.10.2","_nodeVersion":"12.13.1","_npmVersion":"6.12.1","dist":{"integrity":"sha512-ZaZoay04VLDlps6548rXU7uiOVI3Rljg1m188AMgKP6lHx3zW6BJMnTKfQDcLGziuGcPc3C5GhB7OxcSXu5SJg==","shasum":"9f8004d93737a5ae7a0a200d77d999e6930ffcb6","tarball":"https://registry.npmjs.org/locuszoom/-/locuszoom-0.10.2.tgz","fileCount":181,"unpackedSize":15963042,"npm-signature":"-----BEGIN PGP SIGNATURE-----\r\nVersion: OpenPGP.js v3.0.4\r\nComment: https://openpgpjs.org\r\n\r\nwsFcBAEBCAAQBQJeQtTfCRA9TVsSAnZWagAAmTcP/is2AKs20S+MOMfsCPDj\nQgs2qBWRGPxtHc5s6zSlrb4P5wtgKKGW0E8ImD6yQK3T49C9AF1W98wZxtNH\njxyJ4XQhABcOlyxA2KYrdgl95XZc9EyJTnSyVp5q+VWWHJnyfrPbARkPl59C\nOyEz2ErEnNn18zXzeZ01vDZ6pNnnbS9BOET1OE0e65UQbF6ctUER+VmmTqCf\nmw3Cj9+VespZOfiFhcMV7RJDB8F5xdMosygIjYgWxUcQ7AUBFCO3MbmPfKPB\nGDynGiPzJBu90OKs3kL0KUbuAsDSIUvQawOul5cpolN0b05BbCUhqsI6vgIt\n6Lc+4FRGW9dfCXsNNIxgUuuMGfchE+9KECK8wnkXNO/BqBEYQ2/NPTXdCrqF\ntQmQKwaWrdo1GUDIrpRLLkfONl4593HgInrPYNnSrIL6tEtLeM3ITe1bM/4A\nRw+B4jcgYtAGDItkr7jnlpYyPJ4JtqXVg+wrovNSDawEeEEmnWDUNgRIl4TU\nahrvuZP6pzkGJ8pVUXsnlypi53c/lnq056YpdDFkKpNyyoSY6sLL/IrHIhKs\nz5MyznTnIEXvhvS8hznxgVFCgQ32LmV6yZ6+HoXUlP/cQs5F9n3ANGaup0Ub\n3jgbvkwdXzPlsdBLq41HHJYcoz1P5I0nhCzofKsGyyHP7tSPryTL/csp0dRM\nn4SN\r\n=4fXM\r\n-----END PGP SIGNATURE-----\r\n","signatures":[{"keyid":"SHA256:jl3bwswu80PjjokCgh0o2w5c2U4LhQAE57gj9cz1kzA","sig":"MEUCIEsR7W3CrOUWUrh4KgwGsY1f31gUQC5EGLJ/yOwMOsvGAiEAz/Bta5TURH/PqccgwKSW9VU7K5GUFwXZCczeb5V5YTI="}]},"maintainers":[{"name":"abought","email":"abought@gmail.com"},{"name":"frencil","email":"frencils@gmail.com"}],"_npmUser":{"name":"abought","email":"abought@gmail.com"},"directories":{},"_npmOperationalInternal":{"host":"s3://npm-registry-packages","tmp":"tmp/locuszoom_0.10.2_1581438174895_0.7356069094135562"},"_hasShrinkwrap":false},"0.11.0-beta.1":{"name":"locuszoom","version":"0.11.0-beta.1","description":"Generate interactive visualizations of statistical genetic data","keywords":["visualization","genetics","genes","gwas","phewas"],"homepage":"http://locuszoom.org","license":"MIT","author":{"name":"Christopher Clark","email":"chriclrk@umich.edu"},"contributors":[{"name":"Matthew Flickinger"},{"name":"Ryan Welch"},{"name":"Peter VandeHaar"},{"name":"Andy Boughton","email":"abought@umich.edu"}],"main":"dist/locuszoom.app.min.js","engines":{"node":">=8.9.0"},"repository":{"type":"git","url":"git+https://github.com/statgen/locuszoom.git"},"scripts":{"build":"gulp build","test":"gulp test","lint":"gulp lint","watch":"gulp watch"},"dependencies":{"d3":"3.5.17","promise-polyfill":"^8.1.3"},"devDependencies":{"del":"~3.0.0","eslint":"^5.16.0","glob":"^7.1.3","gulp":"^4.0.0","gulp-concat":"~2.6.1","gulp-eslint":"~5.0.0","gulp-filter":"^5.1.0","gulp-mocha":"~6.0.0","gulp-rename":"~1.4.0","gulp-sass":"~4.0.2","gulp-sourcemaps":"~2.6.4","gulp-uglify":"~3.0.1","gulp-util":"~3.0.8","gulp-watch":"~5.0.1","gulp-wrap-js":"~0.4.1","jsdoc":"^3.6.3","jsdom":"~9.12.0","mocha":"~5.2.0","mocha-jsdom":"~2.0.0","should":"^13.2.3","sinon":"^6.1.6","yargs":"^12.0.2"},"readme":"# LocusZoom\n\nLocusZoom is a Javascript/d3 embeddable plugin for interactively visualizing statistical genetic data from customizable\n sources.\n\n[](https://api.travis-ci.org/statgen/locuszoom)\n\nSee [github.com/statgen/locuszoom/wiki](https://github.com/statgen/locuszoom/wiki) for full documentation and API reference.\n\nTo see functional examples of plots generated with LocusZoom.js see [statgen.github.io/locuszoom](http://statgen.github.io/locuszoom/) \nand [statgen.github.io/locuszoom/#examples](http://statgen.github.io/locuszoom/#examples).\n\n\n\n## Making a LocusZoom Plot\n\n### 1. Include Necessary JavaScript and CSS\n\nThe page you build that embeds the LocusZoom plugin must include the following resources, found in the `dist` directory:\n\n* `locuszoom.vendor.min.js` \n This file contains the concatenated vendor libraries. You can alternatively include [d3](http://d3js.org/)\n from other sources, so long as it is included **before including LocusZoom files**. This bundle also contains a \n polyfill for ES6 `Promise`, which you may need if your site supports certain older browsers such as Internet Explorer.\n\n* `locuszoom.app.js` OR `locuszoom.app.min.js` \n This is the primary application logic. It should only be included *after* the vendor dependencies have been included. \n\n* `locuszoom.css` \n This is the primary stylesheet. It is namespaced so as not to conflict with any other styles defined on the same page.\n\nCDN links are available for these resources (see [statgen.github.io/locuszoom/](http://statgen.github.io/locuszoom/)).\n\n### 2. Define Data Sources\n\n**Data Sources** is an object representing a collection of arbitrarily many sources from which data for the plot can \nbe requested. When adding sources to the collection they must be namespaced so that retrieving specific fields can be \ndone with respect to specific data sources.\n\nHere's an example of defining a data sources object for a remote API:\n\n```javascript\nvar data_sources = new LocusZoom.DataSources();\ndata_sources.add(\"trait\", [\"AssociationLZ\", { url: \"http://server.com/api/\" }]);\n```\n\nThe above example adds an \"AssociationLZ\" data source (a predefined data source designed to make requests for \nassociation data) with a defined URL. The namespace for this data source is \"trait\".\n\nData sources can also be local files:\n\n```javascript\ndata_sources = new LocusZoom.DataSources();\ndata_sources.add(\"trait\", [\"AssociationLZ\", { url: \"file:///path/to/data.json\" }]);\n```\n\nRefer to the [Data Sources Documentation](https://github.com/statgen/locuszoom/wiki/Data-Sources) for more information \non using predefined data sources or extending/creating custom data sources.\n\n### 3. Define a Layout\n\n**Layout** is a serializable object that describes the configuration of the LocusZoom plot, including what data will be\n pulled from the data sources and displayed in what way, along with visual characteristics like color and geometry.\n\nA layout definition may look something like this:\n\n```javascript\nvar layout = {\n width: 500,\n height: 500,\n panels: [\n {\n id: \"association\",\n data_layers: [\n {\n id: \"association\",\n type: \"scatter\",\n fields: [\"trait:position\", \"trait:pvalue\"],\n x_axis: { field: \"trait:position\" },\n y_axis: { field: \"trait:pvalue\" }\n }\n ]\n }\n ]\n};\n```\n\nThe above example defines a basic plot that is 500 pixels on a side and has one panel with one scatter plot data layer\n that pulls in position and pvalue from the \"trait\" data source, mapping position to the x axis and pvalue to the y axis.\n\nThe LocusZoom.js library provides several pre-defined layouts for entire plots and subdivisions of plots such as panels,\n data layers, tool tips, etc. Refer to the [Layout Documentation](https://github.com/statgen/locuszoom/wiki/Layout) \n for more information.\n\n### 4. Put it Together with `LocusZoom.populate()`\n\nWith includes included, data sources defined, and a layout defined, `LocusZoom.populate()` will accept a CSS selector \nstring to populate the first matching element with a plot.\n\nA basic example may then look like this:\n\n```html\n\n \n \n \n \n \n \n \n \n \n\n```\n\n### Other Ways To Make a LocusZoom Plot\n\n#### Use a Predefined Layout\n\nThe core LocusZoom library comes equipped with several predefined layouts, organized by type (\"plot\", \"panel\", \n\"data_layer\", and \"dashboard\"). You can see what layouts are predefined by reading the contents of \n`assets/js/app/Layouts.js` or in the browser by entering `LocusZoom.Layouts.list()` (or to list one specific type: \n`LocusZoom.Layouts.list(type)`).\n\nGet any predefined layout by type and name using `LocusZoom.Layouts.get(type, name)`.\n \nIf no layout is passed to `LocusZoom.populate()` the Standard GWAS plot layout is used (requiring appropriate data \nsources to be configured).\n\n#### Build a Layout Using Some Predefined Pieces\n\n`LocusZoom.Layouts.get(type, name)` can also be used to pull predefined layouts of smaller pieces, like data layers or \ndashboards, into a custom layout:\n\n```javascript\nvar layout = {\n width: 1000,\n height: 500,\n panels: [\n LocusZoom.Layouts.get(\"panel\",\"gwas\"),\n {\n id: \"custom_panel\",\n ...\n },\n LocusZoom.Layouts.get(\"panel\",\"genes\")\n ]\n ...\n};\n```\n\n#### Modify a Predefined Layout\n\nThe `get()` function also accepts a partial layout to be merged with the predefined layout as a third argument, \nproviding the ability to use predefined layouts as starting points for custom layouts with only minor differences. Example:\n\n```javascript\nvar changes = {\n label_font_size: 20,\n transition: false\n};\nLocusZoom.Layouts.get(\"data_layer\", \"genes\", changes);\n```\n\n#### Predefining State by Building a State Object\n\n**State** is a serializable JSON object that describes orientation to specific data from data sources, and specific \ninteractions with the layout. This can include a specific query against various data sources or pre-selecting specific\n elements. Essentially, the state object is what tracks these types of user input under the hood in LocusZoom, and it \n can be predefined at initialization as a top-level parameter in the layout. For example:\n\n```javascript\nvar layout = LocusZoom.Layouts.merge({ state: { chr: 6, start: 20379709, end: 20979709 } }, LocusZoom.StandardLayout);\n```\n\n#### Predefining State With `data-region`\n\nYou can also describe the locus query aspect of the State (chromosome, start, and end position) using a `data-region`\n attribute of the containing element before populating it, like so:\n\n```html\n\n```\n\nWhen `LocusZoom.populate()` is executed on the element defined above it will automatically parse any `data-region` \nparameter to convert those values into the initial state.\n\n#### Making Many LocusZoom Plots at Once\n\n`LocusZoom.populate()` will only populate the first matching HTML element for the provided selector string. To populate \nall matching elements for a single selector string use `LocusZoom.populateAll()` like so:\n\n```html\n\n\n\n\n```\n\n## Development Setup\n\n### Dependencies\n\nLocusZoom is an entirely client-side application designed to plug into arbitrary data sets, be they local files, APIs,\n or something else entirely. It has the following vendor dependencies:\n\n* [d3](http://d3js.org/) for a data visualization framework\n\n### Build System and Automated Testing\n\nThe application is built using [Gulp](http://gulpjs.com/). Gulp and all necessary dev dependencies can be installed for\n this project from the top-level directory using the following commands:\n\n```\n$ npm install\n```\n\nOnce complete run `npx gulp build` from the top of the application directory to run all tests and build the \nfollowing files (in the `dist` folder):\n\n* `locuszoom.app.js` - A concatenated app file suitable for use in development\n* `locuszoom.app.min.js` - A concatenated and minified app file suitable for use in production\n* `locuszoom.vendor.min.js` - A concatenated vendor file suitable for use as a single vendor include in either \ndevelopment or production (contains d3)\n* `locuszoom.css` - A generated CSS file for all LocusZoom styles\n\nThis build process will also write sourcemaps, to help with debugging code even in production environments.\n\n#### Other supported gulp commands:\n* `npx gulp build` - Build app and vendor js files (runs tests and aborts if tests fail)\n* `npx gulp watch` - Watch for any changes to app .js, .scss, or test source files to trigger another full build\n* `npx gulp test` - Just run the tests\n* `npx gulp app_js` - Build app js files (does not run tests)\n* `npx gulp ext_js` - Build extensions (features that are not part of LocusZoom core)\n* `npx gulp vendor_js` - Build vendor js file\n* `npx gulp css` - Build CSS file\n\n#### The `--force` Flag\n\nAppend `--force` to the end of any gulp command that runs the automated testing suite to force the creation of \n`locuszoom.app.js` and `locuszoom.app.min.js` **even when the tests fail**. This can be useful during active \ndevelopment as sometimes debugging can be led from either the output of automated tests or inspection of \nan active plugin.\n\nThis flag is particularly useful with the watch command:\n\n`$ npx gulp watch --force`\n\nThe above command with enter forced-watch-mode, which will detect any changes to app .js or .scss files, as well as \ntest files, and run a new build. If errors are encountered in the tests they will be reported, but `locuszoom.app.js`\n and `locuszoom.app.min.js` will still be generated and gulp will not exit but return to watch mode. **This is an \n effective way to have automatic continuous builds while developing both the application and its tests.**\n\n#### Automated Testing\n\nLocusZoom uses [Mocha](https://mochajs.org/) for unit testing. Tests are located in the `test` subdirectory, with \na one-to-one mapping of test files to app files.\n\n**Note that the build and test process requires Node.js version 6 LTS or higher.**\n\n### Linting and Strict Mode\n\nAll app-specific javascript files should be developed in **strict mode**. LocusZoom is also linted using \n[ESLint](http://eslint.org/), the rules for which can be found in `.eslintrc`.\n\n## Help and Support\n\nFull documentation can be found here: [github.com/statgen/locuszoom/wiki](https://github.com/statgen/locuszoom/wiki)\n\nA LocusZoom discussion forum is available here: [groups.google.com/forum/#!forum/locuszoom](https://groups.google.com/forum/#!forum/locuszoom). \nFor the most effective help, please specify that your question is about \"LocusZoom.js\".\n\nIf you have questions or feedback please file an issue on the [LocusZoom.js GitHub repository](https://github.com/statgen/locuszoom/issues) or post at the discussion forum referenced above.\n","readmeFilename":"README.md","gitHead":"df60653af4d5fc79fe992a31f5fe8f7093ee901f","bugs":{"url":"https://github.com/statgen/locuszoom/issues"},"_id":"locuszoom@0.11.0-beta.1","_nodeVersion":"12.13.1","_npmVersion":"6.12.1","dist":{"integrity":"sha512-vtEorrux9gLx7YrGpyLia5Hp9w90EJ9vw6wXT4vENBoN1UA4Gzw6dFHIUcdCx0eoy+Qmi6pwpWPd7YHF4zmkmg==","shasum":"ae0b852b6a37fdd6dc54a635793c9354e43ad9c6","tarball":"https://registry.npmjs.org/locuszoom/-/locuszoom-0.11.0-beta.1.tgz","fileCount":215,"unpackedSize":15671246,"npm-signature":"-----BEGIN PGP SIGNATURE-----\r\nVersion: OpenPGP.js v3.0.4\r\nComment: https://openpgpjs.org\r\n\r\nwsFcBAEBCAAQBQJe2VcbCRA9TVsSAnZWagAAeqgP+wQcmdQVV8hddXRtZAUD\nn5As2ziZFIUB9nSHZhb9WEkPdnVkY9XMdV3ka4sbcwTXlVvfo5ZyC+yH4inF\nSOUgzS6ai+p+65mNvdA2CUGUADgvpGvqGoUe9J08yUGpHScEpRuFnkXVkF1K\nF8Gs5TZPSkXWn2dSEH+if4Z2XYKsZwsnKjWWGBUpWPCnlhgc776R68p2Ip//\n/ZoipjpDSlAeSlul2NIllqcNdmapdQVvDVjah6Yg1EImzGTUxtUKz/+7v0Is\nnZGzK8gMjzX34fjWZkzA6fVzazo0WKTXoCLI3qIsMgkMTITM0oGMFeEVF8dZ\nPX39HUH/1x+bL/PyYubI1HRbu9i7Mz+vZCeoywy96VhZ/oljjSxYG1LQOIu5\nwLbBDiE7KCFuotZhEI/YZhLF+VNZeandeODmD84K9vtJeFe6lZKSNIkACsGt\nKm8YVOZNIrBkmAvciBk44U1umoyQZBkXVV+xDRKhhQWrGMWmiuP1LA4lJCvx\nHI+nuNhU91B47GwY+oNVITpPk2DK2rHcT+RSFtWeuwnkNptMJ00JpXWTDem7\nj5Mshn/weSvneQZp/rAKM72VvTZmVj46W36ChIfiQAhjmkMlUEvjDRYBYAHS\nSb7gDw65aVMN+N+i5gKWHfAKnXBvTZQmJ71NQsE3guherJIw5GEov2KwcTzV\ntU5t\r\n=/t9O\r\n-----END PGP SIGNATURE-----\r\n","signatures":[{"keyid":"SHA256:jl3bwswu80PjjokCgh0o2w5c2U4LhQAE57gj9cz1kzA","sig":"MEUCIQD5oR2IbUjnaLCKCu61fHLnCGbMCyXtzu+nGoZzOaEvwgIgF8pvlFMQk+HaKNDjtqSkc8Qe3cstMvzLTIRHqDNiCXM="}]},"maintainers":[{"name":"abought","email":"abought@gmail.com"},{"name":"frencil","email":"frencils@gmail.com"}],"_npmUser":{"name":"abought","email":"abought@gmail.com"},"directories":{},"_npmOperationalInternal":{"host":"s3://npm-registry-packages","tmp":"tmp/locuszoom_0.11.0-beta.1_1591301915048_0.18096430505673777"},"_hasShrinkwrap":false},"0.11.0":{"name":"locuszoom","version":"0.11.0","description":"Generate interactive visualizations of statistical genetic data","keywords":["visualization","genetics","genes","gwas","phewas"],"homepage":"http://locuszoom.org","license":"MIT","author":{"name":"Christopher Clark","email":"chriclrk@umich.edu"},"contributors":[{"name":"Matthew Flickinger"},{"name":"Ryan Welch"},{"name":"Peter VandeHaar"},{"name":"Andy Boughton","email":"abought@umich.edu"}],"main":"dist/locuszoom.app.min.js","engines":{"node":">=8.9.0"},"repository":{"type":"git","url":"git+https://github.com/statgen/locuszoom.git"},"scripts":{"build":"gulp build","docs":"pandoc -s --toc --css css/pandoc.css assets/docs/layout_tutorial.md -o docs/layout_tutorial.html","test":"gulp test","lint":"gulp lint","watch":"gulp watch"},"dependencies":{"d3":"3.5.17","promise-polyfill":"^8.1.3"},"devDependencies":{"del":"~3.0.0","eslint":"^5.16.0","glob":"^7.1.3","gulp":"^4.0.0","gulp-concat":"~2.6.1","gulp-eslint":"~5.0.0","gulp-filter":"^5.1.0","gulp-mocha":"~6.0.0","gulp-rename":"~1.4.0","gulp-sass":"~4.0.2","gulp-sourcemaps":"~2.6.4","gulp-uglify":"~3.0.1","gulp-util":"~3.0.8","gulp-watch":"~5.0.1","gulp-wrap-js":"~0.4.1","jsdoc":"^3.6.3","jsdom":"~9.12.0","mocha":"~5.2.0","mocha-jsdom":"~2.0.0","should":"^13.2.3","sinon":"^6.1.6","yargs":"^12.0.2"},"gitHead":"bede1ce624221c359275cff5d40c0329faae7d88","bugs":{"url":"https://github.com/statgen/locuszoom/issues"},"_id":"locuszoom@0.11.0","_nodeVersion":"12.18.0","_npmVersion":"6.14.4","dist":{"integrity":"sha512-0aOqDOxKlviGft2VOrlwmRAR0IoTI6HYgflcSJcC8IpT237GX9z1j5VdoOkkQxjPYtTAd1D5BtpYoN/hz3MXSQ==","shasum":"d32b8be1c8134fe04986e17daeeedf4f6a876bd1","tarball":"https://registry.npmjs.org/locuszoom/-/locuszoom-0.11.0.tgz","fileCount":121,"unpackedSize":7345038,"npm-signature":"-----BEGIN PGP SIGNATURE-----\r\nVersion: OpenPGP.js v3.0.4\r\nComment: https://openpgpjs.org\r\n\r\nwsFcBAEBCAAQBQJfCN3jCRA9TVsSAnZWagAAurAQAJyFa/xTzA620LmaZW4E\n4bc2gcsF8wiem4X2H+Z35oaQyuT/Nn9810NijBVJ/Xa84420aO+3AcQ5ouAs\nDacOqPbWwkI2m7UNSljhxi+E2lRvpivaPCJowz8DB03eOKmvuaSZYUHDiPmB\ncDMQH6GjIn3UMPx5g9srNXbYvuJK5mBkJwsaX7EMUujpH4SqUAVzYfdrd2JU\nRFGLK+XVUaa5HvLoshtJ1HlVcMeYPbKGHFGoaW76zljK2zH8OWkFl0mcok+R\nDY82Dz3DqI3MK8e9n4x1FakwSEzaUWgRSGIhHQI3snZ9F0R93CnLDkJP33+B\nC0eL3kLbSVLhVigZPjNsH5ev/gtSbX9kpDkGPBoHuifzu3vKD9mAPGofM6sI\nHe830rO/9s5mxd23l86VX5JsC/dLqgj+nSNrrsesi7kvXaCpThZkkIOu6B1b\nhQU5k+SeP/Qd9p6q4hSa3bRfl3zoSk3Z20WTj4wseZmtKqO6Qi0eVwk7L4B8\nCpOL0nhuivV3sU2Z51eG6GI882uEzLhMzC+zQcwcupyAgE2BlerMdkc/ybsV\nFHCkxqaxyWJXY5i9vlkZbBGjvbKcV25BqnWOM0GKmbpGYqWUnbvW54dTgh3h\nvZ1LK/Q3ONWujp4WnALQww2HWq8qmOT5D238LqfdicI9TJv91pAHGhVcSdQ2\nlLD5\r\n=zJX+\r\n-----END PGP SIGNATURE-----\r\n","signatures":[{"keyid":"SHA256:jl3bwswu80PjjokCgh0o2w5c2U4LhQAE57gj9cz1kzA","sig":"MEUCIQD38OzfkgHrWEi22dHOA884Y5CYL5Zu+iiy9o2JbgeGMAIgNkBBPBku8ATqeYFoLAWv/LeSjB+R5SMw5x49vsSDN6s="}]},"maintainers":[{"name":"abought","email":"abought@gmail.com"},{"name":"frencil","email":"frencils@gmail.com"}],"_npmUser":{"name":"abought","email":"abought@gmail.com"},"directories":{},"_npmOperationalInternal":{"host":"s3://npm-registry-packages","tmp":"tmp/locuszoom_0.11.0_1594416610931_0.7152310330501608"},"_hasShrinkwrap":false},"0.12.0-beta.1":{"name":"locuszoom","version":"0.12.0-beta.1","main":"dist/locuszoom.app.min.js","module":"esm/index.js","sideEffects":true,"description":"Generate interactive visualizations of statistical genetic data","keywords":["visualization","genetics","genes","gwas","phewas"],"homepage":"http://locuszoom.org","license":"MIT","author":{"name":"University of Michigan Center for Statistical Genetics"},"contributors":[{"name":"Christopher Clark"},{"name":"Matthew Flickinger"},{"name":"Ryan Welch"},{"name":"Peter VandeHaar"},{"name":"Andy Boughton","email":"abought@umich.edu"}],"engines":{"node":">=8.9.0"},"repository":{"type":"git","url":"git+https://github.com/statgen/locuszoom.git"},"scripts":{"test":"mocha --recursive test","test:coverage":"nyc --reporter=text mocha --recursive test/**/*.js","css":"sass --style compressed ./css/locuszoom.scss ./dist/locuszoom.css","dev":"npm run css && webpack --watch --config webpack.dev.cjs","prod":"npm run css && webpack --config webpack.prod.cjs","docs":"jsdoc --recurse --readme ./README.md --destination jsdoc esm/ && pandoc -s --toc --css css/pandoc.css assets/docs/layout_tutorial.md -o docs/layout_tutorial.html"},"dependencies":{"d3":"^5.16.0"},"devDependencies":{"@babel/core":"^7.10.2","@babel/preset-env":"^7.10.2","@babel/register":"^7.10.1","babel-loader":"^8.1.0","babel-plugin-module-resolver":"^4.0.0","chai":"^4.2.0","clean-webpack-plugin":"^3.0.0","eslint":"^7.2.0","eslint-loader":"^4.0.2","friendly-errors-webpack-plugin":"^1.7.0","jsdoc":"^3.6.4","jsdom":"^16.2.2","jsdom-global":"^3.0.2","mocha":"~7.2.0","nyc":"^15.1.0","sass":"^1.26.8","sass-loader":"^8.0.2","sinon":"^6.1.6","source-map-loader":"^1.0.0","webpack":"^4.43.0","webpack-cli":"^3.3.11","webpack-merge":"^4.2.2"},"readme":"# LocusZoom\n\nLocusZoom is a Javascript/d3 embeddable plugin for interactively visualizing statistical genetic data from customizable\n sources.\n\n[](https://api.travis-ci.org/statgen/locuszoom)\n\nSee [github.com/statgen/locuszoom/wiki](https://github.com/statgen/locuszoom/wiki) for full documentation and API reference.\n\nTo see functional examples of plots generated with LocusZoom.js see [statgen.github.io/locuszoom](http://statgen.github.io/locuszoom/) \nand [statgen.github.io/locuszoom/#examples](http://statgen.github.io/locuszoom/#examples).\n\n\n\n## Making a LocusZoom Plot\n\n### 1. Include Necessary JavaScript and CSS\n\nThe page you build that embeds the LocusZoom plugin must include the following resources, found in the `dist` directory:\n\n* `d3.js` \n [D3.js](https://d3js.org/) v5.16.0 is used to draw graphics in LocusZoom plots. It may be loaded [via a CDN](https://cdn.jsdelivr.net/npm/d3@^5.16.0). It must be present before LocusZoom is loaded.\n\n* `locuszoom.app.min.js` \n This is the primary application logic. It should only be included *after* the vendor dependencies have been included. \n\n* `locuszoom.css` \n This is the primary stylesheet. It is namespaced so as not to conflict with any other styles defined on the same page.\n\nInstead of copying the files to your project, we recommend using CDN links are for these resources (see [statgen.github.io/locuszoom/](http://statgen.github.io/locuszoom/)).\n\n*The above instructions describe using LocusZoom with pure JS and HTML. If you are using a module build system, LocusZoom supports usage via ES6 imports, eg `import LocusZoom from 'locuszoom';` and `import 'locuszoom/dist/locuszoom.css';`* \n\n### 2. Define Data Sources\n\n**Data Sources** is an object representing a collection of arbitrarily many sources from which data for the plot can \nbe requested. When adding sources to the collection they must be namespaced so that retrieving specific fields can be \ndone with respect to specific data sources.\n\nHere's an example of defining a data sources object for a remote API:\n\n```javascript\nvar data_sources = new LocusZoom.DataSources();\ndata_sources.add(\"trait\", [\"AssociationLZ\", { url: \"http://server.com/api/\", params: {source: 1} }]);\n```\n\nThe above example adds an \"AssociationLZ\" data source (a predefined data source designed to make requests for \nassociation data) with a defined URL. The namespace for this data source is \"trait\".\n\nData sources can also be local files:\n\n```javascript\ndata_sources = new LocusZoom.DataSources();\ndata_sources.add(\"trait\", [\"AssociationLZ\", { url: \"file:///path/to/data.json\" }]);\n```\n\nRefer to the [Data Sources Documentation](https://github.com/statgen/locuszoom/wiki/Data-Sources) for more information \non using predefined data sources or extending/creating custom data sources.\n\n### 3. Define a Layout\n\n**Layout** is a serializable object that describes the configuration of the LocusZoom plot, including what data will be\n pulled from the data sources and displayed in what way, along with visual characteristics like color and geometry.\n\nA layout definition may look something like this:\n\n```javascript\nvar layout = {\n width: 500,\n height: 500,\n panels: [\n {\n id: \"association\",\n data_layers: [\n {\n id: \"association\",\n type: \"scatter\",\n fields: [\"trait:position\", \"trait:pvalue\"],\n x_axis: { field: \"trait:position\" },\n y_axis: { field: \"trait:pvalue\" }\n }\n ]\n }\n ]\n};\n```\n\nThe above example defines a basic plot that is 500 pixels on a side and has one panel with one scatter plot data layer\n that pulls in position and pvalue from the \"trait\" data source, mapping position to the x axis and pvalue to the y axis.\n\nThe LocusZoom.js library provides several pre-defined layouts for entire plots and subdivisions of plots such as panels,\n data layers, tool tips, etc. Refer to the [Layout Documentation](https://github.com/statgen/locuszoom/wiki/Layout) \n for more information.\n\n### 4. Put it Together with `LocusZoom.populate()`\n\nWith includes included, data sources defined, and a layout defined, `LocusZoom.populate()` will accept a CSS selector \nstring to populate the first matching element with a plot.\n\nA basic example may then look like this:\n\n```html\n\n \n \n \n \n \n \n \n \n\n```\n\n### Other Ways To Make a LocusZoom Plot\n\n#### Use a Predefined Layout\n\nThe core LocusZoom library comes equipped with several predefined layouts, organized by type (\"plot\", \"panel\", \n\"data_layer\", and \"toolbar\"). You can see what layouts are predefined by reading the contents of \n`assets/js/app/Layouts.js` or in the browser by entering `LocusZoom.Layouts.list()` (or to list one specific type: \n`LocusZoom.Layouts.list(type)`).\n\nGet any predefined layout by type and name using `LocusZoom.Layouts.get(type, name)`.\n \n#### Build a Layout Using Some Predefined Pieces\n\n`LocusZoom.Layouts.get(type, name)` can also be used to pull predefined layouts of smaller pieces, like data layers or \ntoolbars, into a custom layout:\n\n```javascript\nvar layout = {\n width: 1000,\n height: 500,\n panels: [\n LocusZoom.Layouts.get(\"panel\",\"gwas\"),\n {\n id: \"custom_panel\",\n ...\n },\n LocusZoom.Layouts.get(\"panel\",\"genes\")\n ]\n ...\n};\n```\n\n#### Modify a Predefined Layout\n\nThe `get()` function also accepts a partial layout to be merged with the predefined layout as a third argument, \nproviding the ability to use predefined layouts as starting points for custom layouts with only minor differences. Example:\n\n```javascript\nvar changes = {\n label_font_size: 20,\n transition: false\n};\nLocusZoom.Layouts.get(\"data_layer\", \"genes\", changes);\n```\n\n#### Predefining State by Building a State Object\n\n**State** is a serializable JSON object that describes orientation to specific data from data sources, and specific \ninteractions with the layout. This can include a specific query against various data sources or pre-selecting specific\n elements. Essentially, the state object is what tracks these types of user input under the hood in LocusZoom, and it \n can be predefined at initialization as a top-level parameter in the layout. For example:\n\n```javascript\nvar layout = LocusZoom.Layouts.get('plot', 'standard_association', { state: { chr: 6, start: 20379709, end: 20979709 } })\n```\n\n#### Predefining State With `data-region`\n\nYou can also describe the locus query aspect of the State (chromosome, start, and end position) using a `data-region`\n attribute of the containing element before populating it, like so:\n\n```html\n\n```\n\nWhen `LocusZoom.populate()` is executed on the element defined above it will automatically parse any `data-region` \nparameter to convert those values into the initial state.\n\n## Development Setup\n\n### Dependencies\n\nLocusZoom is an entirely client-side application designed to plug into arbitrary data sets, be they local files, APIs,\n or something else entirely. It has the following vendor dependencies:\n\n* [d3](http://d3js.org/) for a data visualization framework\n\n### Build System and Automated Testing\n\nLocusZoom is bundled using Webpack. To install all necessary dependencies for a development environment, run:\n\n```\n$ npm install\n```\n\nWe recommend using node.js v12 or greater to build the library and run tests.\n\nOnce complete run `npm test && npm prod` from the top of the application directory to run all tests and build the LocusZoom library bundle.\n\nThis build process will also write sourcemaps, to help with debugging code even in production environments.\n\n#### Other supported gulp commands:\n* `npm run test` - Run unit tests (optional: `npm run test:coverage` to output a code coverage report)\n* `npm run dev` - Automatically rebuild the library whenever code changes (development mode)\n* `npm run prod` - Build the library for release (production mode)\n* `npm run css` - Rebuild the CSS using SASS\n* `npm run docs` - Build the library documentation\n\n\n#### Automated Testing\n\nLocusZoom uses [Mocha](https://mochajs.org/) for unit testing. Tests are located in the `test` subdirectory.\n\n### Linting\nLocusZoom is also linted using \n[ESLint](http://eslint.org/), the rules for which can be found in `.eslintrc`. This will run automatically as part of all new code commits, and during every build. \n\n## Help and Support\n\nFull documentation can be found here: [github.com/statgen/locuszoom/wiki](https://github.com/statgen/locuszoom/wiki)\n\nA LocusZoom discussion forum is available here: [groups.google.com/forum/#!forum/locuszoom](https://groups.google.com/forum/#!forum/locuszoom). \nFor the most effective help, please specify that your question is about \"LocusZoom.js\".\n\nIf you have questions or feedback please file an issue on the [LocusZoom.js GitHub repository](https://github.com/statgen/locuszoom/issues) or post at the discussion forum referenced above.\n","readmeFilename":"README.md","gitHead":"42e9d879514953043210c7bbdb45a40d1f5a2be8","bugs":{"url":"https://github.com/statgen/locuszoom/issues"},"_id":"locuszoom@0.12.0-beta.1","_nodeVersion":"12.18.0","_npmVersion":"6.14.4","dist":{"integrity":"sha512-WmvxxTN6NINgH9AjbTtykBF22GT1h6dWy4+7315mzCyPHCx348EUfx3jd4bMSFNpo39NSYmXeMXfuYh8m+WQew==","shasum":"653386bcd66e8adb39f8166a79c8003e1f3c1f22","tarball":"https://registry.npmjs.org/locuszoom/-/locuszoom-0.12.0-beta.1.tgz","fileCount":140,"unpackedSize":5314033,"npm-signature":"-----BEGIN PGP SIGNATURE-----\r\nVersion: OpenPGP.js v3.0.4\r\nComment: https://openpgpjs.org\r\n\r\nwsFcBAEBCAAQBQJfDdf2CRA9TVsSAnZWagAAP/UP/1d0h8/FhFamMFHOTJwE\n+nhJaoev1I2r9MZjcC1SzRq2/vDFYnIyYtsDz16nfdGv4DvdDA7LNL451WKY\nvrcOziN7mafHhIJ+n86BU3BAIqOUhDQwwbv8E+Jh63pbrVGCe9+gpauGr8el\nzJJ4NySWb3RyhacuG2AGeC0YHzrbx78WqvKg9jEUMOUJXtXZER45o9JTaV4B\nYgBff2cOAlZf5YTIcBNcTEwmtWoAvZ1aopzhz0xl2LV4BOWtqwNrDytiQrA9\n4U1cbriG8ld82wyB3BKU/kiL3l7pdraToZABe76xslrahfmv6kFNMRnXeUC6\nqBOxlsK8+hNOIS6RaTPBUIe4PFWggWRfX4DtNP3jrT9x/gv8St5aWXHKjg/v\nhI5tyDgSMYZcHLYKHicUoGIlvE4lT1iuPdIYoo6ABB04VJsrxlR66C1YJ7ll\nlFKfXssTEXljFf0HKp0CW39XBf+V+zVD3u1lroB/x0ZZQD0xWovmUJ0XH6TE\nBj3FszDeW3Qvvwk8Ngkp58TTQDrN1NF3ZtrwDwtbtN32MszpEgn/iUn5wN+i\nURwKaJUH+54CvySBcj76Xe93nkJoSaQE8nm37suUkZ1sFesk68q92PDFkCFk\n0eb3QN2OKuTRu9Qq0Y12aTT5pjQ4vZC9e+ND+W758g9CTDgUA2surT06L0fL\npZj5\r\n=Qu8k\r\n-----END PGP SIGNATURE-----\r\n","signatures":[{"keyid":"SHA256:jl3bwswu80PjjokCgh0o2w5c2U4LhQAE57gj9cz1kzA","sig":"MEUCICuLMtD0OYtBWS8hhuUOs4uOvdVWNYr/fT1P4Ua8yeyiAiEA/NN8pv3Unc8xQGLl5eDkrxC3mRuHg8/pSGspSU0IZKo="}]},"maintainers":[{"name":"abought","email":"abought@gmail.com"},{"name":"frencil","email":"frencils@gmail.com"}],"_npmUser":{"name":"abought","email":"abought@gmail.com"},"directories":{},"_npmOperationalInternal":{"host":"s3://npm-registry-packages","tmp":"tmp/locuszoom_0.12.0-beta.1_1594742774094_0.2780412350672463"},"_hasShrinkwrap":false},"0.12.0-beta.2":{"name":"locuszoom","version":"0.12.0-beta.2","main":"dist/locuszoom.app.min.js","module":"esm/index.js","sideEffects":true,"description":"Generate interactive visualizations of statistical genetic data","keywords":["visualization","genetics","genes","gwas","phewas"],"homepage":"http://locuszoom.org","license":"MIT","author":{"name":"University of Michigan Center for Statistical Genetics"},"contributors":[{"name":"Christopher Clark"},{"name":"Matthew Flickinger"},{"name":"Ryan Welch"},{"name":"Peter VandeHaar"},{"name":"Andy Boughton","email":"abought@umich.edu"}],"engines":{"node":">=12.13.0"},"repository":{"type":"git","url":"git+https://github.com/statgen/locuszoom.git"},"scripts":{"test":"mocha --recursive test","test:coverage":"nyc --reporter=text mocha --recursive test/**/*.js","css":"sass --style compressed ./css/locuszoom.scss ./dist/locuszoom.css","dev":"npm run css && webpack --watch --config webpack.dev.cjs","build":"npm run test && npm run css && webpack --config webpack.prod.cjs","docs":"jsdoc --recurse --readme ./README.md --destination jsdoc esm/ && pandoc -s --toc --css css/pandoc.css assets/docs/layout_tutorial.md -o docs/layout_tutorial.html"},"dependencies":{"d3":"^5.16.0"},"devDependencies":{"@babel/core":"^7.10.2","@babel/preset-env":"^7.10.2","@babel/register":"^7.10.1","babel-loader":"^8.1.0","babel-plugin-module-resolver":"^4.0.0","chai":"^4.2.0","clean-webpack-plugin":"^3.0.0","eslint":"^7.2.0","eslint-loader":"^4.0.2","friendly-errors-webpack-plugin":"^1.7.0","jsdoc":"^3.6.4","jsdom":"^16.2.2","jsdom-global":"^3.0.2","mocha":"~7.2.0","nyc":"^15.1.0","sass":"^1.26.8","sass-loader":"^8.0.2","sinon":"^6.1.6","source-map-loader":"^1.0.0","webpack":"^4.43.0","webpack-cli":"^3.3.11","webpack-merge":"^4.2.2"},"readme":"# LocusZoom\n\nLocusZoom is a Javascript/d3 embeddable plugin for interactively visualizing statistical genetic data from customizable\n sources.\n\n[](https://api.travis-ci.org/statgen/locuszoom)\n\nSee [github.com/statgen/locuszoom/wiki](https://github.com/statgen/locuszoom/wiki) for full documentation and API reference.\n\nTo see functional examples of plots generated with LocusZoom.js see [statgen.github.io/locuszoom](http://statgen.github.io/locuszoom/) \nand [statgen.github.io/locuszoom/#examples](http://statgen.github.io/locuszoom/#examples).\n\n\n\n## Making a LocusZoom Plot\n\n### 1. Include Necessary JavaScript and CSS\n\nThe page you build that embeds the LocusZoom plugin must include the following resources, found in the `dist` directory:\n\n* `d3.js` \n [D3.js](https://d3js.org/) v5.16.0 is used to draw graphics in LocusZoom plots. It may be loaded [via a CDN](https://cdn.jsdelivr.net/npm/d3@^5.16.0). It must be present before LocusZoom is loaded.\n\n* `locuszoom.app.min.js` \n This is the primary application logic. It should only be included *after* the vendor dependencies have been included. \n\n* `locuszoom.css` \n This is the primary stylesheet. It is namespaced so as not to conflict with any other styles defined on the same page.\n\nInstead of copying the files to your project, we recommend using CDN links are for these resources (see [statgen.github.io/locuszoom/](http://statgen.github.io/locuszoom/)).\n\n*The above instructions describe using LocusZoom with pure JS and HTML. If you are using a module build system, LocusZoom supports usage via ES6 imports, eg `import LocusZoom from 'locuszoom';` and `import 'locuszoom/dist/locuszoom.css';`* \n\n### 2. Define Data Sources\n\n**Data Sources** is an object representing a collection of arbitrarily many sources from which data for the plot can \nbe requested. When adding sources to the collection they must be namespaced so that retrieving specific fields can be \ndone with respect to specific data sources.\n\nHere's an example of defining a data sources object for a remote API:\n\n```javascript\nvar data_sources = new LocusZoom.DataSources();\ndata_sources.add(\"trait\", [\"AssociationLZ\", { url: \"http://server.com/api/\", params: {source: 1} }]);\n```\n\nThe above example adds an \"AssociationLZ\" data source (a predefined data source designed to make requests for \nassociation data) with a defined URL. The namespace for this data source is \"trait\".\n\nData sources can also be local files:\n\n```javascript\ndata_sources = new LocusZoom.DataSources();\ndata_sources.add(\"trait\", [\"AssociationLZ\", { url: \"file:///path/to/data.json\" }]);\n```\n\nRefer to the [Data Sources Documentation](https://github.com/statgen/locuszoom/wiki/Data-Sources) for more information \non using predefined data sources or extending/creating custom data sources.\n\n### 3. Define a Layout\n\n**Layout** is a serializable object that describes the configuration of the LocusZoom plot, including what data will be\n pulled from the data sources and displayed in what way, along with visual characteristics like color and geometry.\n\nA layout definition may look something like this:\n\n```javascript\nvar layout = {\n width: 500,\n height: 500,\n panels: [\n {\n id: \"association\",\n data_layers: [\n {\n id: \"association\",\n type: \"scatter\",\n fields: [\"trait:position\", \"trait:pvalue\"],\n x_axis: { field: \"trait:position\" },\n y_axis: { field: \"trait:pvalue\" }\n }\n ]\n }\n ]\n};\n```\n\nThe above example defines a basic plot that is 500 pixels on a side and has one panel with one scatter plot data layer\n that pulls in position and pvalue from the \"trait\" data source, mapping position to the x axis and pvalue to the y axis.\n\nThe LocusZoom.js library provides several pre-defined layouts for entire plots and subdivisions of plots such as panels,\n data layers, tool tips, etc. Refer to the [Layout Documentation](https://github.com/statgen/locuszoom/wiki/Layout) \n for more information.\n\n### 4. Put it Together with `LocusZoom.populate()`\n\nWith includes included, data sources defined, and a layout defined, `LocusZoom.populate()` will accept a CSS selector \nstring to populate the first matching element with a plot.\n\nA basic example may then look like this:\n\n```html\n\n \n \n \n \n \n \n \n \n\n```\n\n### Other Ways To Make a LocusZoom Plot\n\n#### Use a Predefined Layout\n\nThe core LocusZoom library comes equipped with several predefined layouts, organized by type (\"plot\", \"panel\", \n\"data_layer\", and \"toolbar\"). You can see what layouts are predefined by reading the contents of \n`assets/js/app/Layouts.js` or in the browser by entering `LocusZoom.Layouts.list()` (or to list one specific type: \n`LocusZoom.Layouts.list(type)`).\n\nGet any predefined layout by type and name using `LocusZoom.Layouts.get(type, name)`.\n \n#### Build a Layout Using Some Predefined Pieces\n\n`LocusZoom.Layouts.get(type, name)` can also be used to pull predefined layouts of smaller pieces, like data layers or \ntoolbars, into a custom layout:\n\n```javascript\nvar layout = {\n width: 1000,\n height: 500,\n panels: [\n LocusZoom.Layouts.get(\"panel\",\"gwas\"),\n {\n id: \"custom_panel\",\n ...\n },\n LocusZoom.Layouts.get(\"panel\",\"genes\")\n ]\n ...\n};\n```\n\n#### Modify a Predefined Layout\n\nThe `get()` function also accepts a partial layout to be merged with the predefined layout as a third argument, \nproviding the ability to use predefined layouts as starting points for custom layouts with only minor differences. Example:\n\n```javascript\nvar changes = {\n label_font_size: 20,\n transition: false\n};\nLocusZoom.Layouts.get(\"data_layer\", \"genes\", changes);\n```\n\n#### Predefining State by Building a State Object\n\n**State** is a serializable JSON object that describes orientation to specific data from data sources, and specific \ninteractions with the layout. This can include a specific query against various data sources or pre-selecting specific\n elements. Essentially, the state object is what tracks these types of user input under the hood in LocusZoom, and it \n can be predefined at initialization as a top-level parameter in the layout. For example:\n\n```javascript\nvar layout = LocusZoom.Layouts.get('plot', 'standard_association', { state: { chr: 6, start: 20379709, end: 20979709 } })\n```\n\n#### Predefining State With `data-region`\n\nYou can also describe the locus query aspect of the State (chromosome, start, and end position) using a `data-region`\n attribute of the containing element before populating it, like so:\n\n```html\n\n```\n\nWhen `LocusZoom.populate()` is executed on the element defined above it will automatically parse any `data-region` \nparameter to convert those values into the initial state.\n\n## Development Setup\n\n### Dependencies\n\nLocusZoom is an entirely client-side application designed to plug into arbitrary data sets, be they local files, APIs,\n or something else entirely. It has the following vendor dependencies:\n\n* [d3](http://d3js.org/) for a data visualization framework\n\n### Build System and Automated Testing\n\nLocusZoom is bundled using Webpack. To install all necessary dependencies for a development environment, run:\n\n```\n$ npm install\n```\n\nWe recommend using node.js v12 or greater to build the library and run tests.\n\nOnce complete run `npm run build` from the top of the application directory to run all tests and build the LocusZoom library bundle.\n\nThis build process will also write sourcemaps, to help with debugging code even in production environments.\n\n#### Other supported gulp commands:\n* `npm run test` - Run unit tests (optional: `npm run test:coverage` to output a code coverage report)\n* `npm run dev` - Automatically rebuild the library whenever code changes (development mode)\n* `npm run build` - Run tests, and if they pass, build the library for release\n* `npm run css` - Rebuild the CSS using SASS\n* `npm run docs` - Build the library documentation\n\n\n#### Automated Testing\n\nLocusZoom uses [Mocha](https://mochajs.org/) for unit testing. Tests are located in the `test` subdirectory.\n\n### Linting\nLocusZoom is also linted using \n[ESLint](http://eslint.org/), the rules for which can be found in `.eslintrc`. This will run automatically as part of all new code commits, and during every build. \n\n## Help and Support\n\nFull documentation can be found here: [github.com/statgen/locuszoom/wiki](https://github.com/statgen/locuszoom/wiki)\n\nA LocusZoom discussion forum is available here: [groups.google.com/forum/#!forum/locuszoom](https://groups.google.com/forum/#!forum/locuszoom). \nFor the most effective help, please specify that your question is about \"LocusZoom.js\".\n\nIf you have questions or feedback please file an issue on the [LocusZoom.js GitHub repository](https://github.com/statgen/locuszoom/issues) or post at the discussion forum referenced above.\n","readmeFilename":"README.md","gitHead":"7b143dae4f5f0df56ec728495aad5ad697349c9a","bugs":{"url":"https://github.com/statgen/locuszoom/issues"},"_id":"locuszoom@0.12.0-beta.2","_nodeVersion":"12.18.0","_npmVersion":"6.14.4","dist":{"integrity":"sha512-bIikuYjCaHEDiG5Ni/cJq/DoyLfjU5VklH+dmCF9OpbVsUqa8pjyDRRFUK/N6u+QY02V9H9byrsTFO+6mZntiQ==","shasum":"27c28bee251abf3a54ff1d0176486fe7cd5c2b4c","tarball":"https://registry.npmjs.org/locuszoom/-/locuszoom-0.12.0-beta.2.tgz","fileCount":141,"unpackedSize":4559796,"npm-signature":"-----BEGIN PGP SIGNATURE-----\r\nVersion: OpenPGP.js v3.0.4\r\nComment: https://openpgpjs.org\r\n\r\nwsFcBAEBCAAQBQJfIIvNCRA9TVsSAnZWagAAVrgP/3daO7t1vJZZwQhLBdFZ\nEjk8v5AxFbpGpco4pwX+29uany7Z8W8AzKYLf4qIytOA9OjTxOmtl88KTbcu\ngJpPa1+fawd0q4bU164Dww8adD8Sg9cKkBvON9W+1RNHHeT1qq6/kHi+0Lsb\nBHna6h2Hkd7/6Gts7a+1bac7hrkt3m93naaM6GoVnfy8ov6vf4QvMMvmsqyk\ni1wEr5OrJfcJncEgf93DgZveBl7IM0zfet3K/O3u+A5e1lFYAtEsJOxQMjdU\nEi21SJhuen0SHB9yYaFGHRszlXFSbULUuJcxvCRTOxlWvSnAaknlXdz0Sh6w\nnMoAbKQbAdnA+F9FiwDacA54+JrIZBHEiIm0jteHjCsjQPZ3zCTF7yMaOBIb\nafPSDGmMDFn6tOMqZcwlHrmtXwVaPSgSfUjQqxlycH8KnQcLbQJuiEuCYiYt\nx0IYiKB/78CBudZMg2OXjRoIYL/Ql6ZJKtHzBJxFHdLybL+QXszLMmA2ABSM\n+xinc+2X28tjLxPdlMmaDrjEzWIDa3U1TqSK+CoWCWwFOP9c6eMfQpk7aMIA\nKslM0WGF8rKil64XaZoPJiRVfp3CUxw4kiYK2uV+BlXIglslj3vlLHVcusVo\nqZvnZb99bmq6Hyi8x/yRhxCNSsKi/ILi62iOI3yQiuTzvB2JMPwv5d3+DtYJ\nzGSm\r\n=aSKZ\r\n-----END PGP SIGNATURE-----\r\n","signatures":[{"keyid":"SHA256:jl3bwswu80PjjokCgh0o2w5c2U4LhQAE57gj9cz1kzA","sig":"MEUCIQDbkCgMAQEiqzrGLT2oiFT//bFG7cLctJq/LJ8vb9zg2AIgawFi/qdI38pwMr0UYaDs+BYCduY41TulSjoj4meypnU="}]},"maintainers":[{"name":"abought","email":"abought@gmail.com"},{"name":"frencil","email":"frencils@gmail.com"}],"_npmUser":{"name":"abought","email":"abought@gmail.com"},"directories":{},"_npmOperationalInternal":{"host":"s3://npm-registry-packages","tmp":"tmp/locuszoom_0.12.0-beta.2_1595968460244_0.7468063069990194"},"_hasShrinkwrap":false},"0.12.0-beta.3":{"name":"locuszoom","version":"0.12.0-beta.3","main":"dist/locuszoom.app.min.js","module":"esm/index.js","sideEffects":true,"description":"Generate interactive visualizations of statistical genetic data","keywords":["visualization","genetics","genes","gwas","phewas"],"homepage":"http://locuszoom.org","license":"MIT","author":{"name":"University of Michigan Center for Statistical Genetics"},"contributors":[{"name":"Christopher Clark"},{"name":"Matthew Flickinger"},{"name":"Ryan Welch"},{"name":"Peter VandeHaar"},{"name":"Andy Boughton","email":"abought@umich.edu"}],"engines":{"node":">=10.13.0"},"repository":{"type":"git","url":"git+https://github.com/statgen/locuszoom.git"},"scripts":{"test":"mocha --recursive test","test:coverage":"nyc --reporter=text mocha --recursive test/**/*.js","css":"sass --style compressed ./css/locuszoom.scss ./dist/locuszoom.css","dev":"npm run css && webpack --watch --config webpack.dev.cjs","build":"npm run test && npm run css && webpack --config webpack.prod.cjs","docs":"jsdoc --recurse --readme ./README.md --destination jsdoc esm/ && pandoc -s --toc --css css/pandoc.css assets/docs/layout_tutorial.md -o docs/layout_tutorial.html"},"dependencies":{"d3":"^5.16.0"},"devDependencies":{"@babel/core":"^7.10.2","@babel/preset-env":"^7.10.2","@babel/register":"^7.10.1","babel-loader":"^8.1.0","babel-plugin-module-resolver":"^4.0.0","chai":"^4.2.0","clean-webpack-plugin":"^3.0.0","eslint":"^7.2.0","eslint-loader":"^4.0.2","friendly-errors-webpack-plugin":"^1.7.0","jsdoc":"^3.6.4","jsdom":"^16.2.2","jsdom-global":"^3.0.2","mocha":"~7.2.0","nyc":"^15.1.0","sass":"^1.26.8","sass-loader":"^8.0.2","sinon":"^6.1.6","source-map-loader":"^1.0.0","webpack":"^4.43.0","webpack-cli":"^3.3.11","webpack-merge":"^4.2.2"},"readme":"# LocusZoom\n\nLocusZoom is a Javascript/d3 embeddable plugin for interactively visualizing statistical genetic data from customizable\n sources.\n\n[](https://api.travis-ci.org/statgen/locuszoom)\n\nSee [github.com/statgen/locuszoom/wiki](https://github.com/statgen/locuszoom/wiki) for full documentation and API reference.\n\nTo see functional examples of plots generated with LocusZoom.js see [statgen.github.io/locuszoom](http://statgen.github.io/locuszoom/) \nand [statgen.github.io/locuszoom/#examples](http://statgen.github.io/locuszoom/#examples).\n\n\n\n## Making a LocusZoom Plot\n\n### 1. Include Necessary JavaScript and CSS\n\nThe page you build that embeds the LocusZoom plugin must include the following resources, found in the `dist` directory:\n\n* `d3.js` \n [D3.js](https://d3js.org/) v5.16.0 is used to draw graphics in LocusZoom plots. It may be loaded [via a CDN](https://cdn.jsdelivr.net/npm/d3@^5.16.0). It must be present before LocusZoom is loaded.\n\n* `locuszoom.app.min.js` \n This is the primary application logic. It should only be included *after* the vendor dependencies have been included. \n\n* `locuszoom.css` \n This is the primary stylesheet. It is namespaced so as not to conflict with any other styles defined on the same page.\n\nInstead of copying the files to your project, we recommend using CDN links are for these resources (see [statgen.github.io/locuszoom/](http://statgen.github.io/locuszoom/)).\n\n*The above instructions describe using LocusZoom with pure JS and HTML. If you are using a module build system, LocusZoom supports usage via ES6 imports, eg `import LocusZoom from 'locuszoom';` and `import 'locuszoom/dist/locuszoom.css';`* \n\n### 2. Define Data Sources\n\n**Data Sources** is an object representing a collection of arbitrarily many sources from which data for the plot can \nbe requested. When adding sources to the collection they must be namespaced so that retrieving specific fields can be \ndone with respect to specific data sources.\n\nHere's an example of defining a data sources object for a remote API:\n\n```javascript\nvar data_sources = new LocusZoom.DataSources();\ndata_sources.add(\"trait\", [\"AssociationLZ\", { url: \"http://server.com/api/\", params: {source: 1} }]);\n```\n\nThe above example adds an \"AssociationLZ\" data source (a predefined data source designed to make requests for \nassociation data) with a defined URL. The namespace for this data source is \"trait\".\n\nData sources can also be local files:\n\n```javascript\ndata_sources = new LocusZoom.DataSources();\ndata_sources.add(\"trait\", [\"AssociationLZ\", { url: \"file:///path/to/data.json\" }]);\n```\n\nRefer to the [Data Sources Documentation](https://github.com/statgen/locuszoom/wiki/Data-Sources) for more information \non using predefined data sources or extending/creating custom data sources.\n\n### 3. Define a Layout\n\n**Layout** is a serializable object that describes the configuration of the LocusZoom plot, including what data will be\n pulled from the data sources and displayed in what way, along with visual characteristics like color and geometry.\n\nA layout definition may look something like this:\n\n```javascript\nvar layout = {\n width: 500,\n height: 500,\n panels: [\n {\n id: \"association\",\n data_layers: [\n {\n id: \"association\",\n type: \"scatter\",\n fields: [\"trait:position\", \"trait:pvalue\"],\n x_axis: { field: \"trait:position\" },\n y_axis: { field: \"trait:pvalue\" }\n }\n ]\n }\n ]\n};\n```\n\nThe above example defines a basic plot that is 500 pixels on a side and has one panel with one scatter plot data layer\n that pulls in position and pvalue from the \"trait\" data source, mapping position to the x axis and pvalue to the y axis.\n\nThe LocusZoom.js library provides several pre-defined layouts for entire plots and subdivisions of plots such as panels,\n data layers, tool tips, etc. Refer to the [Layout Documentation](https://github.com/statgen/locuszoom/wiki/Layout) \n for more information.\n\n### 4. Put it Together with `LocusZoom.populate()`\n\nWith includes included, data sources defined, and a layout defined, `LocusZoom.populate()` will accept a CSS selector \nstring to populate the first matching element with a plot.\n\nA basic example may then look like this:\n\n```html\n\n \n \n \n \n \n \n \n \n\n```\n\n### Other Ways To Make a LocusZoom Plot\n\n#### Use a Predefined Layout\n\nThe core LocusZoom library comes equipped with several predefined layouts, organized by type (\"plot\", \"panel\", \n\"data_layer\", and \"toolbar\"). You can see what layouts are predefined by reading the contents of \n`assets/js/app/Layouts.js` or in the browser by entering `LocusZoom.Layouts.list()` (or to list one specific type: \n`LocusZoom.Layouts.list(type)`).\n\nGet any predefined layout by type and name using `LocusZoom.Layouts.get(type, name)`.\n \n#### Build a Layout Using Some Predefined Pieces\n\n`LocusZoom.Layouts.get(type, name)` can also be used to pull predefined layouts of smaller pieces, like data layers or \ntoolbars, into a custom layout:\n\n```javascript\nvar layout = {\n width: 1000,\n height: 500,\n panels: [\n LocusZoom.Layouts.get(\"panel\",\"gwas\"),\n {\n id: \"custom_panel\",\n ...\n },\n LocusZoom.Layouts.get(\"panel\",\"genes\")\n ]\n ...\n};\n```\n\n#### Modify a Predefined Layout\n\nThe `get()` function also accepts a partial layout to be merged with the predefined layout as a third argument, \nproviding the ability to use predefined layouts as starting points for custom layouts with only minor differences. Example:\n\n```javascript\nvar changes = {\n label_font_size: 20,\n transition: false\n};\nLocusZoom.Layouts.get(\"data_layer\", \"genes\", changes);\n```\n\n#### Predefining State by Building a State Object\n\n**State** is a serializable JSON object that describes orientation to specific data from data sources, and specific \ninteractions with the layout. This can include a specific query against various data sources or pre-selecting specific\n elements. Essentially, the state object is what tracks these types of user input under the hood in LocusZoom, and it \n can be predefined at initialization as a top-level parameter in the layout. For example:\n\n```javascript\nvar layout = LocusZoom.Layouts.get('plot', 'standard_association', { state: { chr: 6, start: 20379709, end: 20979709 } })\n```\n\n#### Predefining State With `data-region`\n\nYou can also describe the locus query aspect of the State (chromosome, start, and end position) using a `data-region`\n attribute of the containing element before populating it, like so:\n\n```html\n\n```\n\nWhen `LocusZoom.populate()` is executed on the element defined above it will automatically parse any `data-region` \nparameter to convert those values into the initial state.\n\n## Development Setup\n\n### Dependencies\n\nLocusZoom is an entirely client-side application designed to plug into arbitrary data sets, be they local files, APIs,\n or something else entirely. It has the following vendor dependencies:\n\n* [d3](http://d3js.org/) for a data visualization framework\n\n### Build System and Automated Testing\n\nLocusZoom is bundled using Webpack. To install all necessary dependencies for a development environment, run:\n\n```\n$ npm install\n```\n\nWe recommend using node.js v12 or greater to build the library and run tests.\n\nOnce complete run `npm run build` from the top of the application directory to run all tests and build the LocusZoom library bundle.\n\nThis build process will also write sourcemaps, to help with debugging code even in production environments.\n\n#### Other supported gulp commands:\n* `npm run test` - Run unit tests (optional: `npm run test:coverage` to output a code coverage report)\n* `npm run dev` - Automatically rebuild the library whenever code changes (development mode)\n* `npm run build` - Run tests, and if they pass, build the library for release\n* `npm run css` - Rebuild the CSS using SASS\n* `npm run docs` - Build the library documentation\n\n\n#### Automated Testing\n\nLocusZoom uses [Mocha](https://mochajs.org/) for unit testing. Tests are located in the `test` subdirectory.\n\n### Linting\nLocusZoom is also linted using \n[ESLint](http://eslint.org/), the rules for which can be found in `.eslintrc`. This will run automatically as part of all new code commits, and during every build. \n\n## Help and Support\n\nFull documentation can be found here: [github.com/statgen/locuszoom/wiki](https://github.com/statgen/locuszoom/wiki)\n\nA LocusZoom discussion forum is available here: [groups.google.com/forum/#!forum/locuszoom](https://groups.google.com/forum/#!forum/locuszoom). \nFor the most effective help, please specify that your question is about \"LocusZoom.js\".\n\nIf you have questions or feedback please file an issue on the [LocusZoom.js GitHub repository](https://github.com/statgen/locuszoom/issues) or post at the discussion forum referenced above.\n","readmeFilename":"README.md","gitHead":"af61facb47b6fbf33c3153dddf03a015d591dbf6","bugs":{"url":"https://github.com/statgen/locuszoom/issues"},"_id":"locuszoom@0.12.0-beta.3","_nodeVersion":"12.18.0","_npmVersion":"6.14.4","dist":{"integrity":"sha512-U+NQaRZUHSOPlh4st4dfhkP9Q9wtZzjaECTD5OAGCQ+ceiwILn922iALKHib9hkmGhHqg/21vWtJESnSlVHrag==","shasum":"d1aedf3dbe9f125256b22f0e0220953ac79f2a29","tarball":"https://registry.npmjs.org/locuszoom/-/locuszoom-0.12.0-beta.3.tgz","fileCount":141,"unpackedSize":4560306,"npm-signature":"-----BEGIN PGP SIGNATURE-----\r\nVersion: OpenPGP.js v3.0.4\r\nComment: https://openpgpjs.org\r\n\r\nwsFcBAEBCAAQBQJfJINiCRA9TVsSAnZWagAApN4P/1SmrE+ptkAkqEr7nKfV\nuE79sQ57DE0uKPgnLDN2/vatF8UjfjGX//a2ooHi1KhGU/DciGenz4N7pdhH\n58+TUy0g/ssKd/esTjrxAqqO7uQ5jIpf8Z7ZQLOU9LEkujgdMg7dNtpWS/N/\ntxUHUpYUqiUVgt3nf7D+LgyFjUuqWRARlo+ub67ghFGe4YL6oaz+aFo54YQi\nYjk64DzV/gozRrk5FrVTGh9uXZyqVi52YB2SVKcWWgqeDsSpKP8EueDhSM7D\nFudUYvOo3xuPaRJ7bPI7T4UCXDH8UAx3mdOlNnw8WIL2cX5m67AWvXvpoo9g\nYC0lqWHBHGNDCcrtKhwR3SBXnJu5fy54NUs3BuYUWfbc4vg3YexWNge2ypPo\n2Q3QgN4dz9e36iPwpXIHMZRWIRAoOPCTgituiUk0K40M0mqtOeOmGFiplFVZ\nMBtaC2urNZ2ORwgL4n8osU9kde6RCuegyfT5UE3sF1rfgHeln5zDiRfLhvDb\nbYSOnUdS5tcsoG9bNfHXzpqNmEWw3o7S+wlpN/i9JSOO0RotX7aMwn1HV4r6\n7j3vZwvqasV4blrSPRrTezIXop/5jhdLnr8Q5zv9cwbUErY9vfOtal1pcE1f\ntDIKox2eH509UgUknwJMyHxYNgARqfBGnvsPmSjYGcD8ugf9Xuviyf9+nQXT\nTSMc\r\n=ankj\r\n-----END PGP SIGNATURE-----\r\n","signatures":[{"keyid":"SHA256:jl3bwswu80PjjokCgh0o2w5c2U4LhQAE57gj9cz1kzA","sig":"MEQCIGl4T18rqgISKX0nSRBukwD0EGs7ne/uqrlmXTFQ+5dJAiB1Xz9qH2Nlzxja0B1Ct0JikS03Z3AaV7GkaVxx8v7CKQ=="}]},"maintainers":[{"name":"abought","email":"abought@gmail.com"},{"name":"frencil","email":"frencils@gmail.com"}],"_npmUser":{"name":"abought","email":"abought@gmail.com"},"directories":{},"_npmOperationalInternal":{"host":"s3://npm-registry-packages","tmp":"tmp/locuszoom_0.12.0-beta.3_1596228449945_0.2413315941941725"},"_hasShrinkwrap":false},"0.12.0-beta.4":{"name":"locuszoom","version":"0.12.0-beta.4","main":"dist/locuszoom.app.min.js","module":"esm/index.js","sideEffects":true,"description":"Generate interactive visualizations of statistical genetic data","keywords":["visualization","genetics","genes","gwas","phewas"],"homepage":"http://locuszoom.org","license":"MIT","author":{"name":"University of Michigan Center for Statistical Genetics"},"contributors":[{"name":"Christopher Clark"},{"name":"Matthew Flickinger"},{"name":"Ryan Welch"},{"name":"Peter VandeHaar"},{"name":"Andy Boughton","email":"abought@umich.edu"}],"engines":{"node":">=10.13.0"},"repository":{"type":"git","url":"git+https://github.com/statgen/locuszoom.git"},"scripts":{"test":"mocha --recursive test","test:coverage":"nyc --reporter=text mocha --recursive test/**/*.js","css":"sass --style compressed ./css/locuszoom.scss ./dist/locuszoom.css","dev":"npm run css && webpack --watch --config webpack.dev.cjs","build":"npm run test && npm run css && webpack --config webpack.prod.cjs","docs":"jsdoc --recurse --readme ./README.md --destination jsdoc esm/ && pandoc -s --toc --css css/pandoc.css assets/docs/layout_tutorial.md -o docs/layout_tutorial.html"},"dependencies":{"d3":"^5.16.0"},"devDependencies":{"@babel/core":"^7.10.2","@babel/preset-env":"^7.10.2","@babel/register":"^7.10.1","babel-loader":"^8.1.0","babel-plugin-module-resolver":"^4.0.0","chai":"^4.2.0","clean-webpack-plugin":"^3.0.0","eslint":"^7.2.0","eslint-loader":"^4.0.2","friendly-errors-webpack-plugin":"^1.7.0","jsdoc":"^3.6.4","jsdom":"^16.2.2","jsdom-global":"^3.0.2","mocha":"~7.2.0","nyc":"^15.1.0","sass":"^1.26.8","sass-loader":"^8.0.2","sinon":"^6.1.6","source-map-loader":"^1.0.0","webpack":"^4.43.0","webpack-cli":"^3.3.11","webpack-merge":"^4.2.2"},"readme":"# LocusZoom\n\nLocusZoom is a Javascript/d3 embeddable plugin for interactively visualizing statistical genetic data from customizable\n sources.\n\n[](https://api.travis-ci.org/statgen/locuszoom)\n\nSee [github.com/statgen/locuszoom/wiki](https://github.com/statgen/locuszoom/wiki) for full documentation and API reference.\n\nTo see functional examples of plots generated with LocusZoom.js see [statgen.github.io/locuszoom](http://statgen.github.io/locuszoom/) \nand [statgen.github.io/locuszoom/#examples](http://statgen.github.io/locuszoom/#examples).\n\n\n\n## Making a LocusZoom Plot\n\n### 1. Include Necessary JavaScript and CSS\n\nThe page you build that embeds the LocusZoom plugin must include the following resources, found in the `dist` directory:\n\n* `d3.js` \n [D3.js](https://d3js.org/) v5.16.0 is used to draw graphics in LocusZoom plots. It may be loaded [via a CDN](https://cdn.jsdelivr.net/npm/d3@^5.16.0). It must be present before LocusZoom is loaded.\n\n* `locuszoom.app.min.js` \n This is the primary application logic. It should only be included *after* the vendor dependencies have been included. \n\n* `locuszoom.css` \n This is the primary stylesheet. It is namespaced so as not to conflict with any other styles defined on the same page.\n\nInstead of copying the files to your project, we recommend using CDN links are for these resources (see [statgen.github.io/locuszoom/](http://statgen.github.io/locuszoom/)).\n\n*The above instructions describe using LocusZoom with pure JS and HTML. If you are using a module build system, LocusZoom supports usage via ES6 imports, eg `import LocusZoom from 'locuszoom';` and `import 'locuszoom/dist/locuszoom.css';`* \n\n### 2. Define Data Sources\n\n**Data Sources** is an object representing a collection of arbitrarily many sources from which data for the plot can \nbe requested. When adding sources to the collection they must be namespaced so that retrieving specific fields can be \ndone with respect to specific data sources.\n\nHere's an example of defining a data sources object for a remote API:\n\n```javascript\nvar data_sources = new LocusZoom.DataSources();\ndata_sources.add(\"trait\", [\"AssociationLZ\", { url: \"http://server.com/api/\", params: {source: 1} }]);\n```\n\nThe above example adds an \"AssociationLZ\" data source (a predefined data source designed to make requests for \nassociation data) with a defined URL. The namespace for this data source is \"trait\".\n\nData sources can also be local files:\n\n```javascript\ndata_sources = new LocusZoom.DataSources();\ndata_sources.add(\"trait\", [\"AssociationLZ\", { url: \"file:///path/to/data.json\" }]);\n```\n\nRefer to the [Data Sources Documentation](https://github.com/statgen/locuszoom/wiki/Data-Sources) for more information \non using predefined data sources or extending/creating custom data sources.\n\n### 3. Define a Layout\n\n**Layout** is a serializable object that describes the configuration of the LocusZoom plot, including what data will be\n pulled from the data sources and displayed in what way, along with visual characteristics like color and geometry.\n\nA layout definition may look something like this:\n\n```javascript\nvar layout = {\n width: 500,\n height: 500,\n panels: [\n {\n id: \"association\",\n data_layers: [\n {\n id: \"association\",\n type: \"scatter\",\n fields: [\"trait:position\", \"trait:pvalue\"],\n x_axis: { field: \"trait:position\" },\n y_axis: { field: \"trait:pvalue\" }\n }\n ]\n }\n ]\n};\n```\n\nThe above example defines a basic plot that is 500 pixels on a side and has one panel with one scatter plot data layer\n that pulls in position and pvalue from the \"trait\" data source, mapping position to the x axis and pvalue to the y axis.\n\nThe LocusZoom.js library provides several pre-defined layouts for entire plots and subdivisions of plots such as panels,\n data layers, tool tips, etc. Refer to the [Layout Documentation](https://github.com/statgen/locuszoom/wiki/Layout) \n for more information.\n\n### 4. Put it Together with `LocusZoom.populate()`\n\nWith includes included, data sources defined, and a layout defined, `LocusZoom.populate()` will accept a CSS selector \nstring to populate the first matching element with a plot.\n\nA basic example may then look like this:\n\n```html\n\n \n \n \n \n \n \n \n \n\n```\n\n### Other Ways To Make a LocusZoom Plot\n\n#### Use a Predefined Layout\n\nThe core LocusZoom library comes equipped with several predefined layouts, organized by type (\"plot\", \"panel\", \n\"data_layer\", and \"toolbar\"). You can see what layouts are predefined by reading the contents of \n`assets/js/app/Layouts.js` or in the browser by entering `LocusZoom.Layouts.list()` (or to list one specific type: \n`LocusZoom.Layouts.list(type)`).\n\nGet any predefined layout by type and name using `LocusZoom.Layouts.get(type, name)`.\n \n#### Build a Layout Using Some Predefined Pieces\n\n`LocusZoom.Layouts.get(type, name)` can also be used to pull predefined layouts of smaller pieces, like data layers or \ntoolbars, into a custom layout:\n\n```javascript\nvar layout = {\n width: 1000,\n height: 500,\n panels: [\n LocusZoom.Layouts.get(\"panel\",\"gwas\"),\n {\n id: \"custom_panel\",\n ...\n },\n LocusZoom.Layouts.get(\"panel\",\"genes\")\n ]\n ...\n};\n```\n\n#### Modify a Predefined Layout\n\nThe `get()` function also accepts a partial layout to be merged with the predefined layout as a third argument, \nproviding the ability to use predefined layouts as starting points for custom layouts with only minor differences. Example:\n\n```javascript\nvar changes = {\n label_font_size: 20,\n transition: false\n};\nLocusZoom.Layouts.get(\"data_layer\", \"genes\", changes);\n```\n\n#### Predefining State by Building a State Object\n\n**State** is a serializable JSON object that describes orientation to specific data from data sources, and specific \ninteractions with the layout. This can include a specific query against various data sources or pre-selecting specific\n elements. Essentially, the state object is what tracks these types of user input under the hood in LocusZoom, and it \n can be predefined at initialization as a top-level parameter in the layout. For example:\n\n```javascript\nvar layout = LocusZoom.Layouts.get('plot', 'standard_association', { state: { chr: 6, start: 20379709, end: 20979709 } })\n```\n\n#### Predefining State With `data-region`\n\nYou can also describe the locus query aspect of the State (chromosome, start, and end position) using a `data-region`\n attribute of the containing element before populating it, like so:\n\n```html\n\n```\n\nWhen `LocusZoom.populate()` is executed on the element defined above it will automatically parse any `data-region` \nparameter to convert those values into the initial state.\n\n## Development Setup\n\n### Dependencies\n\nLocusZoom is an entirely client-side application designed to plug into arbitrary data sets, be they local files, APIs,\n or something else entirely. It has the following vendor dependencies:\n\n* [d3](http://d3js.org/) for a data visualization framework\n\n### Build System and Automated Testing\n\nLocusZoom is bundled using Webpack. To install all necessary dependencies for a development environment, run:\n\n```\n$ npm install\n```\n\nWe recommend using node.js v12 or greater to build the library and run tests.\n\nOnce complete run `npm run build` from the top of the application directory to run all tests and build the LocusZoom library bundle.\n\nThis build process will also write sourcemaps, to help with debugging code even in production environments.\n\n#### Other supported gulp commands:\n* `npm run test` - Run unit tests (optional: `npm run test:coverage` to output a code coverage report)\n* `npm run dev` - Automatically rebuild the library whenever code changes (development mode)\n* `npm run build` - Run tests, and if they pass, build the library for release\n* `npm run css` - Rebuild the CSS using SASS\n* `npm run docs` - Build the library documentation\n\n\n#### Automated Testing\n\nLocusZoom uses [Mocha](https://mochajs.org/) for unit testing. Tests are located in the `test` subdirectory.\n\n### Linting\nLocusZoom is also linted using \n[ESLint](http://eslint.org/), the rules for which can be found in `.eslintrc`. This will run automatically as part of all new code commits, and during every build. \n\n## Help and Support\n\nFull documentation can be found here: [github.com/statgen/locuszoom/wiki](https://github.com/statgen/locuszoom/wiki)\n\nA LocusZoom discussion forum is available here: [groups.google.com/forum/#!forum/locuszoom](https://groups.google.com/forum/#!forum/locuszoom). \nFor the most effective help, please specify that your question is about \"LocusZoom.js\".\n\nIf you have questions or feedback please file an issue on the [LocusZoom.js GitHub repository](https://github.com/statgen/locuszoom/issues) or post at the discussion forum referenced above.\n","readmeFilename":"README.md","gitHead":"ae59a0591179b5b92cd3002dc9439471ceaab9eb","bugs":{"url":"https://github.com/statgen/locuszoom/issues"},"_id":"locuszoom@0.12.0-beta.4","_nodeVersion":"12.18.0","_npmVersion":"6.14.4","dist":{"integrity":"sha512-tsX2vIu6KLCfi338duaE8dpiSRgl1S9mruugOPhK/HFQ5skpQLagWZKY9VLVNMCS+1zu3dkWPxHA2kKx/c10Kg==","shasum":"640501c40f2981d00b2386057b2a18d2787c3f42","tarball":"https://registry.npmjs.org/locuszoom/-/locuszoom-0.12.0-beta.4.tgz","fileCount":141,"unpackedSize":4566833,"npm-signature":"-----BEGIN PGP SIGNATURE-----\r\nVersion: OpenPGP.js v3.0.4\r\nComment: https://openpgpjs.org\r\n\r\nwsFcBAEBCAAQBQJfLFGVCRA9TVsSAnZWagAAE0MP/1UKlN2WVeX3XT0HPP7S\nPg5rOXtRiIspxV61X7OJUV+EJkKgfaMX9bSut4/h2Dor172rJpjqNxYwb9+c\n9RTnVmHc4Nppn3peofekrsPjP7JYFD6Yjha/moSpppTjBADhfxiDzwCoMRpL\nCB8cujGRJEIbQnDmWdeRRZj3hnUd56Y2HRLRjEoCZ7gA5lIm1bXzr9Sl7E7b\naXJdL7hVGuSNOjxIqXvYpBf3aAliaoeHqo3CVwerSLE+CDvWSGGW0/ajO5Gz\noOqMK2E7+wxv9/HQtszcwMye4oSMqL9o7JpERQ6RLAeFn7JM8YIdgwE/nxBt\neQXyfnUuTPktQwS8rT3qw+zUD1r36HyLnWYiw2uYa/O09HNIJeLEQ8X3REpv\nEjmDB56Ps2Yq4n1dSA5fRPXwXF2RWOspqXgMFJ9iNhbeBDtGOwf/zZwcDxOF\n0FZ/F8O5mGEV8G8Zv+qiG7LpkYS59hrS6BEvkXB1PBMI0S032zRDRq7MDubO\nYb1EU9+QnPxuYtzuXJGmTgHJ7/FsmJZ1zp0byT7HeU36U/r0/XJo3v08WQUY\nrcANh1DsD2xPA1KQQDtBB3+5g4sGDnAzNMqQKCfDhZfaxgg42LTiAe+NYF5G\nEU6ANK5HQFcoU1Wjx+46NuYi2A0o3eKpDcthtbSjCwRz4YU5DzPPWgT6u26F\nf0r7\r\n=YjZF\r\n-----END PGP SIGNATURE-----\r\n","signatures":[{"keyid":"SHA256:jl3bwswu80PjjokCgh0o2w5c2U4LhQAE57gj9cz1kzA","sig":"MEUCIFZErGDBW0x50DvVKODeJpJBMmtoJU62WLLDepupHLlOAiEAxCyXQsXhtLcjPYXIj10CIoksce7L+Bm3Lr81S82HID0="}]},"maintainers":[{"name":"abought","email":"abought@gmail.com"},{"name":"frencil","email":"frencils@gmail.com"}],"_npmUser":{"name":"abought","email":"abought@gmail.com"},"directories":{},"_npmOperationalInternal":{"host":"s3://npm-registry-packages","tmp":"tmp/locuszoom_0.12.0-beta.4_1596739988522_0.8662031909032453"},"_hasShrinkwrap":false},"0.12.0-beta.5":{"name":"locuszoom","version":"0.12.0-beta.5","main":"dist/locuszoom.app.min.js","module":"esm/index.js","sideEffects":true,"description":"Generate interactive visualizations of statistical genetic data","keywords":["visualization","genetics","genes","gwas","phewas"],"homepage":"http://locuszoom.org","license":"MIT","author":{"name":"University of Michigan Center for Statistical Genetics"},"contributors":[{"name":"Christopher Clark"},{"name":"Matthew Flickinger"},{"name":"Ryan Welch"},{"name":"Peter VandeHaar"},{"name":"Andy Boughton","email":"abought@umich.edu"}],"engines":{"node":">=10.13.0"},"repository":{"type":"git","url":"git+https://github.com/statgen/locuszoom.git"},"scripts":{"test":"mocha --recursive test","test:coverage":"nyc --reporter=text mocha --recursive test/**/*.js","css":"sass --style compressed ./css/locuszoom.scss ./dist/locuszoom.css","dev":"npm run css && webpack --watch --config webpack.dev.cjs","build":"npm run test && npm run css && webpack --config webpack.prod.cjs","docs":"jsdoc --recurse --readme ./README.md --destination jsdoc esm/ && pandoc -s --toc --css css/pandoc.css assets/docs/layout_tutorial.md -o docs/layout_tutorial.html"},"dependencies":{"d3":"^5.16.0"},"devDependencies":{"@babel/core":"^7.10.2","@babel/preset-env":"^7.10.2","@babel/register":"^7.10.1","babel-loader":"^8.1.0","babel-plugin-module-resolver":"^4.0.0","chai":"^4.2.0","clean-webpack-plugin":"^3.0.0","eslint":"^7.2.0","eslint-loader":"^4.0.2","friendly-errors-webpack-plugin":"^1.7.0","jsdoc":"^3.6.4","jsdom":"^16.2.2","jsdom-global":"^3.0.2","mocha":"~7.2.0","nyc":"^15.1.0","sass":"^1.26.8","sass-loader":"^8.0.2","sinon":"^6.1.6","source-map-loader":"^1.0.0","webpack":"^4.43.0","webpack-cli":"^3.3.11","webpack-merge":"^4.2.2"},"readme":"# LocusZoom\n\nLocusZoom is a Javascript/d3 embeddable plugin for interactively visualizing statistical genetic data from customizable\n sources.\n\n[](https://api.travis-ci.org/statgen/locuszoom)\n\nSee [github.com/statgen/locuszoom/wiki](https://github.com/statgen/locuszoom/wiki) for full documentation and API reference.\n\nTo see functional examples of plots generated with LocusZoom.js see [statgen.github.io/locuszoom](http://statgen.github.io/locuszoom/) \nand [statgen.github.io/locuszoom/#examples](http://statgen.github.io/locuszoom/#examples).\n\n\n\n## Making a LocusZoom Plot\n\n### 1. Include Necessary JavaScript and CSS\n\nThe page you build that embeds the LocusZoom plugin must include the following resources, found in the `dist` directory:\n\n* `d3.js` \n [D3.js](https://d3js.org/) v5.16.0 is used to draw graphics in LocusZoom plots. It may be loaded [via a CDN](https://cdn.jsdelivr.net/npm/d3@^5.16.0). It must be present before LocusZoom is loaded.\n\n* `locuszoom.app.min.js` \n This is the primary application logic. It should only be included *after* the vendor dependencies have been included. \n\n* `locuszoom.css` \n This is the primary stylesheet. It is namespaced so as not to conflict with any other styles defined on the same page.\n\nInstead of copying the files to your project, we recommend using CDN links are for these resources (see [statgen.github.io/locuszoom/](http://statgen.github.io/locuszoom/)).\n\n*The above instructions describe using LocusZoom with pure JS and HTML. If you are using a module build system, LocusZoom supports usage via ES6 imports, eg `import LocusZoom from 'locuszoom';` and `import 'locuszoom/dist/locuszoom.css';`* \n\n### 2. Define Data Sources\n\n**Data Sources** is an object representing a collection of arbitrarily many sources from which data for the plot can \nbe requested. When adding sources to the collection they must be namespaced so that retrieving specific fields can be \ndone with respect to specific data sources.\n\nHere's an example of defining a data sources object for a remote API:\n\n```javascript\nvar data_sources = new LocusZoom.DataSources();\ndata_sources.add(\"trait\", [\"AssociationLZ\", { url: \"http://server.com/api/\", params: {source: 1} }]);\n```\n\nThe above example adds an \"AssociationLZ\" data source (a predefined data source designed to make requests for \nassociation data) with a defined URL. The namespace for this data source is \"trait\".\n\nData sources can also be local files:\n\n```javascript\ndata_sources = new LocusZoom.DataSources();\ndata_sources.add(\"trait\", [\"AssociationLZ\", { url: \"file:///path/to/data.json\" }]);\n```\n\nRefer to the [Data Sources Documentation](https://github.com/statgen/locuszoom/wiki/Data-Sources) for more information \non using predefined data sources or extending/creating custom data sources.\n\n### 3. Define a Layout\n\n**Layout** is a serializable object that describes the configuration of the LocusZoom plot, including what data will be\n pulled from the data sources and displayed in what way, along with visual characteristics like color and geometry.\n\nA layout definition may look something like this:\n\n```javascript\nvar layout = {\n width: 500,\n height: 500,\n panels: [\n {\n id: \"association\",\n data_layers: [\n {\n id: \"association\",\n type: \"scatter\",\n fields: [\"trait:position\", \"trait:pvalue\"],\n x_axis: { field: \"trait:position\" },\n y_axis: { field: \"trait:pvalue\" }\n }\n ]\n }\n ]\n};\n```\n\nThe above example defines a basic plot that is 500 pixels on a side and has one panel with one scatter plot data layer\n that pulls in position and pvalue from the \"trait\" data source, mapping position to the x axis and pvalue to the y axis.\n\nThe LocusZoom.js library provides several pre-defined layouts for entire plots and subdivisions of plots such as panels,\n data layers, tool tips, etc. Refer to the [Layout Documentation](https://github.com/statgen/locuszoom/wiki/Layout) \n for more information.\n\n### 4. Put it Together with `LocusZoom.populate()`\n\nWith includes included, data sources defined, and a layout defined, `LocusZoom.populate()` will accept a CSS selector \nstring to populate the first matching element with a plot.\n\nA basic example may then look like this:\n\n```html\n\n \n \n \n \n \n \n \n \n\n```\n\n### Other Ways To Make a LocusZoom Plot\n\n#### Use a Predefined Layout\n\nThe core LocusZoom library comes equipped with several predefined layouts, organized by type (\"plot\", \"panel\", \n\"data_layer\", and \"toolbar\"). You can see what layouts are predefined by reading the contents of \n`assets/js/app/Layouts.js` or in the browser by entering `LocusZoom.Layouts.list()` (or to list one specific type: \n`LocusZoom.Layouts.list(type)`).\n\nGet any predefined layout by type and name using `LocusZoom.Layouts.get(type, name)`.\n \n#### Build a Layout Using Some Predefined Pieces\n\n`LocusZoom.Layouts.get(type, name)` can also be used to pull predefined layouts of smaller pieces, like data layers or \ntoolbars, into a custom layout:\n\n```javascript\nvar layout = {\n width: 1000,\n height: 500,\n panels: [\n LocusZoom.Layouts.get(\"panel\",\"gwas\"),\n {\n id: \"custom_panel\",\n ...\n },\n LocusZoom.Layouts.get(\"panel\",\"genes\")\n ]\n ...\n};\n```\n\n#### Modify a Predefined Layout\n\nThe `get()` function also accepts a partial layout to be merged with the predefined layout as a third argument, \nproviding the ability to use predefined layouts as starting points for custom layouts with only minor differences. Example:\n\n```javascript\nvar changes = {\n label_font_size: 20,\n transition: false\n};\nLocusZoom.Layouts.get(\"data_layer\", \"genes\", changes);\n```\n\n#### Predefining State by Building a State Object\n\n**State** is a serializable JSON object that describes orientation to specific data from data sources, and specific \ninteractions with the layout. This can include a specific query against various data sources or pre-selecting specific\n elements. Essentially, the state object is what tracks these types of user input under the hood in LocusZoom, and it \n can be predefined at initialization as a top-level parameter in the layout. For example:\n\n```javascript\nvar layout = LocusZoom.Layouts.get('plot', 'standard_association', { state: { chr: 6, start: 20379709, end: 20979709 } })\n```\n\n#### Predefining State With `data-region`\n\nYou can also describe the locus query aspect of the State (chromosome, start, and end position) using a `data-region`\n attribute of the containing element before populating it, like so:\n\n```html\n\n```\n\nWhen `LocusZoom.populate()` is executed on the element defined above it will automatically parse any `data-region` \nparameter to convert those values into the initial state.\n\n## Development Setup\n\n### Dependencies\n\nLocusZoom is an entirely client-side application designed to plug into arbitrary data sets, be they local files, APIs,\n or something else entirely. It has the following vendor dependencies:\n\n* [d3](http://d3js.org/) for a data visualization framework\n\n### Build System and Automated Testing\n\nLocusZoom is bundled using Webpack. To install all necessary dependencies for a development environment, run:\n\n```\n$ npm install\n```\n\nWe recommend using node.js v12 or greater to build the library and run tests.\n\nOnce complete run `npm run build` from the top of the application directory to run all tests and build the LocusZoom library bundle.\n\nThis build process will also write sourcemaps, to help with debugging code even in production environments.\n\n#### Other supported gulp commands:\n* `npm run test` - Run unit tests (optional: `npm run test:coverage` to output a code coverage report)\n* `npm run dev` - Automatically rebuild the library whenever code changes (development mode)\n* `npm run build` - Run tests, and if they pass, build the library for release\n* `npm run css` - Rebuild the CSS using SASS\n* `npm run docs` - Build the library documentation\n\n\n#### Automated Testing\n\nLocusZoom uses [Mocha](https://mochajs.org/) for unit testing. Tests are located in the `test` subdirectory.\n\n### Linting\nLocusZoom is also linted using \n[ESLint](http://eslint.org/), the rules for which can be found in `.eslintrc`. This will run automatically as part of all new code commits, and during every build. \n\n## Help and Support\n\nFull documentation can be found here: [github.com/statgen/locuszoom/wiki](https://github.com/statgen/locuszoom/wiki)\n\nA LocusZoom discussion forum is available here: [groups.google.com/forum/#!forum/locuszoom](https://groups.google.com/forum/#!forum/locuszoom). \nFor the most effective help, please specify that your question is about \"LocusZoom.js\".\n\nIf you have questions or feedback please file an issue on the [LocusZoom.js GitHub repository](https://github.com/statgen/locuszoom/issues) or post at the discussion forum referenced above.\n","readmeFilename":"README.md","gitHead":"f133a68e3ee60bbdf0bed48a58829bc97705d7be","bugs":{"url":"https://github.com/statgen/locuszoom/issues"},"_id":"locuszoom@0.12.0-beta.5","_nodeVersion":"12.18.0","_npmVersion":"6.14.4","dist":{"integrity":"sha512-HVvMl1Qn4xQrU2dVz3lcZWYUxeMyKLBKBqP0yL3EYqZ/uw9dP8GIQk0GcO+UVeLBx2nAPBWqhHFE6RYSAC98QA==","shasum":"aea4e25507f933ab0a0507e539832bffb82c8dfb","tarball":"https://registry.npmjs.org/locuszoom/-/locuszoom-0.12.0-beta.5.tgz","fileCount":141,"unpackedSize":4568763,"npm-signature":"-----BEGIN PGP SIGNATURE-----\r\nVersion: OpenPGP.js v3.0.4\r\nComment: https://openpgpjs.org\r\n\r\nwsFcBAEBCAAQBQJfNX2ZCRA9TVsSAnZWagAAC4gP/jDcFppZdnH9b1cAJIgF\nFLm0DvJeXHSWgI+TAwEutQ+rUKP+XumGOTeKMKuXSDV+4SGrFwh5WYIDNz+3\nnDShXokUZj2itMgLk5PrnMl6/EH4xz6229VK7qvgWo3Ne2uj+X2feqppp5jA\nEksfQCuWPEzo/f1xV2JUr94Wk6jrtYhkPRJEOpBHf26vQL+pz+DlvLWm/8e1\nlg2qxXaVNW8eC3GZheX4X79hoemtrFpaHaOB/EO9SmYD+5vZOf55gL3wTysZ\npkWDlMMW0prv4XrQKzs3rn43YV9pjmeGoLvYAtylK5HTHMEtnx6ZijCkDC8W\n1GX2jMK7OTx+NKyFo2rC31qy5D/xi7eGa9ET/Ry8L3q8RPZIvx5iCEvmivBI\noMTJqoYCLRt6liwkzUcbq7Iwcx44nAOZkyvv/EzB0Hjk1miwVxoaGzvi5MfF\nRqTeHggFrr3EjqO98KlTXZQC0tiZM/jHNAW3aO5M+Q7O6WEBPy0eiOXY+ncf\nhWxxiPMZi3qykPW3gcuWt2qLPb9s4kw5WiglLgV/XzLRatBJPuO5CXGWGo+o\nxhoDzBPvDcL0qZ9FVuVSC3XzKXfQWD+6PHsGlKorjVqXZIK3AmOUho4ZTWmT\nd64ZwzfNDPmA+3yUoWABl482VkeRTOjKM6LKO3125UxO8xZzT+4ksnQehWrD\nr305\r\n=r1dM\r\n-----END PGP SIGNATURE-----\r\n","signatures":[{"keyid":"SHA256:jl3bwswu80PjjokCgh0o2w5c2U4LhQAE57gj9cz1kzA","sig":"MEUCIG4xcdsxVWeZ+rc7sGctgmJ/9JnHQDbcpCCLbbfllyNOAiEAn0U6r2tTGhjjLb/Ngw/C2fsIAi2zFI6EEASj0BW0+xw="}]},"maintainers":[{"name":"abought","email":"abought@gmail.com"},{"name":"frencil","email":"frencils@gmail.com"}],"_npmUser":{"name":"abought","email":"abought@gmail.com"},"directories":{},"_npmOperationalInternal":{"host":"s3://npm-registry-packages","tmp":"tmp/locuszoom_0.12.0-beta.5_1597341080893_0.6696880138220584"},"_hasShrinkwrap":false},"0.12.0":{"name":"locuszoom","version":"0.12.0","main":"dist/locuszoom.app.min.js","module":"esm/index.js","sideEffects":true,"description":"Generate interactive visualizations of statistical genetic data","keywords":["visualization","genetics","genes","gwas","phewas"],"homepage":"http://locuszoom.org","license":"MIT","author":{"name":"University of Michigan Center for Statistical Genetics"},"contributors":[{"name":"Christopher Clark"},{"name":"Matthew Flickinger"},{"name":"Ryan Welch"},{"name":"Peter VandeHaar"},{"name":"Andy Boughton","email":"abought@umich.edu"}],"engines":{"node":">=10.13.0"},"repository":{"type":"git","url":"git+https://github.com/statgen/locuszoom.git"},"scripts":{"test":"mocha --recursive test","test:coverage":"nyc --reporter=text mocha --recursive test/**/*.js","css":"sass --style compressed ./css/locuszoom.scss ./dist/locuszoom.css","dev":"npm run css && webpack --watch --config webpack.dev.cjs","build":"npm run test && npm run css && webpack --config webpack.prod.cjs","docs":"jsdoc --recurse --readme ./README.md --destination jsdoc esm/ && pandoc -s --toc --css css/pandoc.css assets/docs/layout_tutorial.md -o docs/layout_tutorial.html"},"dependencies":{"d3":"^5.16.0"},"devDependencies":{"@babel/core":"^7.11.1","@babel/preset-env":"^7.11.0","@babel/register":"^7.10.5","babel-loader":"^8.1.0","babel-plugin-module-resolver":"^4.0.0","chai":"^4.2.0","clean-webpack-plugin":"^3.0.0","eslint":"^7.6.0","eslint-loader":"^4.0.2","friendly-errors-webpack-plugin":"^1.7.0","jsdoc":"^3.6.5","jsdom":"^16.4.0","jsdom-global":"^3.0.2","mocha":"~7.2.0","nyc":"^15.1.0","sass":"^1.26.10","sass-loader":"^8.0.2","sinon":"^6.3.5","source-map-loader":"^1.0.1","webpack":"^4.44.1","webpack-cli":"^3.3.12","webpack-merge":"^4.2.2"},"gitHead":"340c0f1e00cbf5a31ee394d914c852022910e0db","bugs":{"url":"https://github.com/statgen/locuszoom/issues"},"_id":"locuszoom@0.12.0","_nodeVersion":"12.18.0","_npmVersion":"6.14.4","dist":{"integrity":"sha512-56CjgXEzNIBHHnOzULzjZ0KWQ0hO7oHotFKtL1c8ad1r1vYuM1o+P+W0J+bmuXdr5Fh28ph9oEhwSyEuMBZFFw==","shasum":"9e2efb255bcf2ab5f64306e95674142e8677b2b2","tarball":"https://registry.npmjs.org/locuszoom/-/locuszoom-0.12.0.tgz","fileCount":141,"unpackedSize":4568728,"npm-signature":"-----BEGIN PGP SIGNATURE-----\r\nVersion: OpenPGP.js v3.0.4\r\nComment: https://openpgpjs.org\r\n\r\nwsFcBAEBCAAQBQJfNtTYCRA9TVsSAnZWagAAJDgP+weQ5CELV11lA1nbmoxX\n0ZhIwgr3zYRXU0uvOsbT+6g9L8PxKR14mtox0Eectl2H03NAzROTkh85cPva\nqMBt7qkhcbkkwgBOsp+lvnyeR4xIXG6UzqEbiy2fC99/n7hXHOqDFmsj7s3W\nFktSsJxnYOm80I375FrK3bMuQSFVLNhNuHbNcyFl8wTKOPlRvSo8SxE02D6G\nd2T9jb1Kx9XfSkHIBFmoaCfg9akj30qU2qguke7hhd385DJean5jBVHbjIeI\nbmmipqPP/ZN+Rrw54yie0eQHplTTSNTHJ5f/uNXPLahdsLOwcjHlDOlmOpuF\nPr2MRqM+se3qUILknLxMbCUAGhGsh7oGdfWhEHX2+V+IoAlOOThuQMNwaKYi\n9bFFuJKk7Yv+J8zUwX4sDW0VT8Hh2RmTGbaY4fD/Nm6u1mJLrU2fTnViqkqz\nw2lJuRvSf88al81AcUFvr1lDQOd/dowvlXu4QcsFpkmMEvce2cHumw5Yesxc\n0mGSxCiEumk4E7ldWC3e5mESYeVv2we7EPYCJ5JoFKwCOkiK8QWVFnfQbFlr\nP2oQwGzrJFG9+JsNgpcFOqNWj5lndm9YuYP5938t9EivPhZEOCpqyL+NCCIF\nDWci6cbf6t0xd4ZoIF/KHUNa6QaA0hQfpW6OxRcBBtb9beFUOTP70KK/Uhgg\nRm+O\r\n=j9Od\r\n-----END PGP SIGNATURE-----\r\n","signatures":[{"keyid":"SHA256:jl3bwswu80PjjokCgh0o2w5c2U4LhQAE57gj9cz1kzA","sig":"MEYCIQCfq2CJQgVAR6EKg2zuQWETmUz8tpeYXb0AgPFHl3LcGwIhALufTcTvbungwP05zLpO0b5pyLb/Q3oIFHK2gAc0b2qf"}]},"maintainers":[{"name":"abought","email":"abought@gmail.com"},{"name":"frencil","email":"frencils@gmail.com"}],"_npmUser":{"name":"abought","email":"abought@gmail.com"},"directories":{},"_npmOperationalInternal":{"host":"s3://npm-registry-packages","tmp":"tmp/locuszoom_0.12.0_1597428952163_0.27500716416576587"},"_hasShrinkwrap":false},"0.12.1":{"name":"locuszoom","version":"0.12.1","main":"dist/locuszoom.app.min.js","module":"esm/index.js","sideEffects":true,"description":"Generate interactive visualizations of statistical genetic data","keywords":["visualization","genetics","genes","gwas","phewas"],"homepage":"http://locuszoom.org","license":"MIT","author":{"name":"University of Michigan Center for Statistical Genetics"},"contributors":[{"name":"Christopher Clark"},{"name":"Matthew Flickinger"},{"name":"Ryan Welch"},{"name":"Peter VandeHaar"},{"name":"Andy Boughton","email":"abought@umich.edu"}],"engines":{"node":">=10.13.0"},"repository":{"type":"git","url":"git+https://github.com/statgen/locuszoom.git"},"scripts":{"test":"mocha --recursive test","test:coverage":"nyc --reporter=text mocha --recursive test/**/*.js","css":"sass --style compressed ./css/locuszoom.scss ./dist/locuszoom.css","dev":"npm run css && webpack --watch --config webpack.dev.cjs","build":"npm run test && npm run css && webpack --config webpack.prod.cjs","docs":"jsdoc --recurse --readme ./README.md --destination jsdoc esm/ && pandoc -s --toc --css css/pandoc.css assets/docs/layout_tutorial.md -o docs/layout_tutorial.html"},"dependencies":{"d3":"^5.16.0"},"devDependencies":{"@babel/core":"^7.11.1","@babel/preset-env":"^7.11.0","@babel/register":"^7.10.5","babel-loader":"^8.1.0","babel-plugin-module-resolver":"^4.0.0","chai":"^4.2.0","clean-webpack-plugin":"^3.0.0","eslint":"^7.6.0","eslint-loader":"^4.0.2","friendly-errors-webpack-plugin":"^1.7.0","jsdoc":"^3.6.5","jsdom":"^16.4.0","jsdom-global":"^3.0.2","mocha":"~7.2.0","nyc":"^15.1.0","sass":"^1.26.10","sass-loader":"^8.0.2","sinon":"^6.3.5","source-map-loader":"^1.0.1","webpack":"^4.44.1","webpack-cli":"^3.3.12","webpack-merge":"^4.2.2"},"gitHead":"4cb89eee53144167649a0b1e010586475d37f1a8","bugs":{"url":"https://github.com/statgen/locuszoom/issues"},"_id":"locuszoom@0.12.1","_nodeVersion":"12.18.0","_npmVersion":"6.14.4","dist":{"integrity":"sha512-lARRLOm/PEYwzZ90z140byS/vtM3qqsxIUPLK+CM65SusQY0HJq7El5ZbxwojuRMIcuI5k4vRxEdye1qWhWzlg==","shasum":"fdaee592bee30db58f914f88c3ba4932785cb64c","tarball":"https://registry.npmjs.org/locuszoom/-/locuszoom-0.12.1.tgz","fileCount":141,"unpackedSize":4572152,"npm-signature":"-----BEGIN PGP SIGNATURE-----\r\nVersion: OpenPGP.js v3.0.4\r\nComment: https://openpgpjs.org\r\n\r\nwsFcBAEBCAAQBQJfRTZWCRA9TVsSAnZWagAAbiAP/iNPQCl78ZN0SeDxjCY9\n/72TcoN6sU1Ugo3JFNmNymWJM8k/DEBAxJvH1ziyjRFGNJ1/RlLAmtyrbCIb\nCIVQ7obZei59/OfXOjgbyiK5GYnhnEopOhMySrF136ZU7ricWOAasV9DMQVK\nX4CFYFCO2gtK749C5PtCrTZAm8rSgwYe+vlv/vZ/7YzvqiJP0x4zAVNILzTn\nPK2B4MN0lQHKec4Gme4zNvUnbizUPydTosdWtkfL4lSmxGZH/nNqWOoBUZUI\nD6kgtc39vcasg2mDrsRtF4CpW+2GjKRYu8OLi5ieaSkFJ3TYHlE2N3sRWjLk\nIMWZgDixDTCY5zWnsj3NZk7ZgrIL5KAlQQvKI6i+f1ySbKDGs0lHpV/YxgtX\n/rdTN5wG7Lx28mTlmDQaaCwbsFNNf6NBJUAQiNAyORUroDc48nxHIWVpYojd\nOCqzssI/8+dkrU2AIYf7/lqFHTmyA3IHb8kzoJ4ZdBBezWdbV6p8dvx8slsr\n7Ja7LubaDijnl8kaRH1uJcbGCkPZ3MqP8ANtUE25ENCQXkjQpKzN3GUJNoWM\nIEfuqnUPFNw1tolILMH+ulpA9tGMDm3+lNxW2HJkhN9c/lB1WCOG1TMHeqtc\nNc0fBXcLbtbUF+/VDdEpO6UV/XaE07tsfCMw64ScWEaVSxQGY99zkbs8gNY1\ntRwq\r\n=nOU1\r\n-----END PGP SIGNATURE-----\r\n","signatures":[{"keyid":"SHA256:jl3bwswu80PjjokCgh0o2w5c2U4LhQAE57gj9cz1kzA","sig":"MEQCIA2stDOBcoJQUCqHY/8IGauGQlGuY+25WRXDtZG6ErBGAiBJZ2visBtoeNuSH5VbDGNiEqzUspNMePRyFDLwC6lHBA=="}]},"maintainers":[{"name":"abought","email":"abought@gmail.com"},{"name":"frencil","email":"frencils@gmail.com"}],"_npmUser":{"name":"abought","email":"abought@gmail.com"},"directories":{},"_npmOperationalInternal":{"host":"s3://npm-registry-packages","tmp":"tmp/locuszoom_0.12.1_1598371414240_0.021281959611118006"},"_hasShrinkwrap":false},"0.12.2":{"name":"locuszoom","version":"0.12.2","main":"dist/locuszoom.app.min.js","module":"esm/index.js","sideEffects":true,"description":"Generate interactive visualizations of statistical genetic data","keywords":["visualization","genetics","genes","gwas","phewas"],"homepage":"http://locuszoom.org","license":"MIT","author":{"name":"University of Michigan Center for Statistical Genetics"},"contributors":[{"name":"Christopher Clark"},{"name":"Matthew Flickinger"},{"name":"Ryan Welch"},{"name":"Peter VandeHaar"},{"name":"Andy Boughton","email":"abought@umich.edu"}],"engines":{"node":">=10.13.0"},"repository":{"type":"git","url":"git+https://github.com/statgen/locuszoom.git"},"scripts":{"test":"mocha --recursive test","test:coverage":"nyc --reporter=text mocha --recursive test/**/*.js","css":"sass --style compressed ./css/locuszoom.scss ./dist/locuszoom.css","dev":"npm run css && webpack --watch --config webpack.dev.cjs","build":"npm run test && npm run css && webpack --config webpack.prod.cjs","docs":"jsdoc --recurse --readme ./README.md --destination jsdoc esm/ && pandoc -s --toc --css css/pandoc.css assets/docs/layout_tutorial.md -o docs/layout_tutorial.html"},"dependencies":{"d3":"^5.16.0"},"devDependencies":{"@babel/core":"^7.11.1","@babel/preset-env":"^7.11.0","@babel/register":"^7.10.5","babel-loader":"^8.1.0","babel-plugin-module-resolver":"^4.0.0","chai":"^4.2.0","clean-webpack-plugin":"^3.0.0","eslint":"^7.6.0","eslint-loader":"^4.0.2","friendly-errors-webpack-plugin":"^1.7.0","jsdoc":"^3.6.5","jsdom":"^16.4.0","jsdom-global":"^3.0.2","mocha":"~7.2.0","nyc":"^15.1.0","sass":"^1.26.10","sass-loader":"^8.0.2","sinon":"^6.3.5","source-map-loader":"^1.0.1","webpack":"^4.44.1","webpack-cli":"^3.3.12","webpack-merge":"^4.2.2"},"gitHead":"d005b99bf5b7bd8523452cc07751c2bbe1ea7c32","bugs":{"url":"https://github.com/statgen/locuszoom/issues"},"_id":"locuszoom@0.12.2","_nodeVersion":"12.18.0","_npmVersion":"6.14.4","dist":{"integrity":"sha512-JwSY0zurKe9oBzqDArQ+1dJGAEeFsipE9860j316aXFzH45RsD+ugmFTcNR/irbbll9zbarTZ8nXTPYWF7STvA==","shasum":"e037ec1d4a2a3eb62c639d3be3a30cea0b2543a7","tarball":"https://registry.npmjs.org/locuszoom/-/locuszoom-0.12.2.tgz","fileCount":141,"unpackedSize":4573373,"npm-signature":"-----BEGIN PGP SIGNATURE-----\r\nVersion: OpenPGP.js v3.0.4\r\nComment: https://openpgpjs.org\r\n\r\nwsFcBAEBCAAQBQJfUAQvCRA9TVsSAnZWagAA9V0QAJ4Qn+E9AFQ0lZSTrJC0\nfinYi4KI4qM3EudPHM359iCgSYjx9YhWKAIRMefMADRxOlC4v5aJ2eKN0BVd\nG7ZZUxZOzjR5t5t9d5xcctG0QdRnp7POZKqIkLzXDL5osFrQGwojTElUef8E\ncbWxMveDejgkL2p9po8GRJ55YCaklq+TD4P1swidewDXNxeWwBQgmDZ5Swyd\nNh7Lh4sWL6WVRBkK/QQ0/noGIZ+9ZbNktjlqK0+hPRPYRnZja5vHDLRc9lwn\nz/pM7JJhRMD7L7TAUFWIzGE3WWzGss0v2SpCRiB4fCfdr7UWxdl4eY/xAEFH\nNGLcfRlWYVculjxZ18w2FD4aSxKMmSrjqkAvLIpj6WmJNvI7wcGBDO0Typs7\nNYaIpfNhqmXsx8V1dsu3G7Ajeu8SeZmHEOVzIa1Vf5ASDpM0z8CGEApAfKjv\nUETB9JQ8wguMYvvbIlCbswPHlyHaU6GmuYanO/OFOyp/pKKpoI9ecDOBYGgY\nt2bIpzr8mhYW8c3RWq52OWqodeIY4VjLNjixiBciwfFBMUoI6jjEaV2bWdaA\nAq+LuFiLbhmH+6RACqkM8VmIOQiRPcoS4bhLcHGqjOspqaD6UouQVcs6NULV\nfaTTZT7C54PXMCbfGiY7G6WtNXtmjwpsSrN5pAkE4QqFlSpzb94OMQwSKKBQ\nUned\r\n=MLTv\r\n-----END PGP SIGNATURE-----\r\n","signatures":[{"keyid":"SHA256:jl3bwswu80PjjokCgh0o2w5c2U4LhQAE57gj9cz1kzA","sig":"MEYCIQDvxEBJDY8ej4Y8KN8Q0vPGc4gXNj/uAbqAQ93fzYu8kgIhAIVci4be0tVpPE3Adf8Wn8H/RRgr7pXSuEFp07/WGH7X"}]},"maintainers":[{"name":"abought","email":"abought@gmail.com"},{"name":"frencil","email":"frencils@gmail.com"}],"_npmUser":{"name":"abought","email":"abought@gmail.com"},"directories":{},"_npmOperationalInternal":{"host":"s3://npm-registry-packages","tmp":"tmp/locuszoom_0.12.2_1599079470332_0.40348248827289046"},"_hasShrinkwrap":false},"0.13.0-beta.1":{"name":"locuszoom","version":"0.13.0-beta.1","main":"dist/locuszoom.app.min.js","module":"esm/index.js","sideEffects":true,"description":"Generate interactive visualizations of statistical genetic data","keywords":["visualization","genetics","genes","gwas","phewas"],"homepage":"http://locuszoom.org","license":"MIT","author":{"name":"University of Michigan Center for Statistical Genetics"},"contributors":[{"name":"Christopher Clark"},{"name":"Matthew Flickinger"},{"name":"Ryan Welch"},{"name":"Peter VandeHaar"},{"name":"Andy Boughton","email":"abought@umich.edu"}],"engines":{"node":">=10.13.0"},"repository":{"type":"git","url":"git+https://github.com/statgen/locuszoom.git"},"scripts":{"test":"eslint esm/ test/ && mocha --recursive test","test:coverage":"nyc --reporter=text mocha --recursive test/**/*.js","css":"sass --style compressed ./css/locuszoom.scss ./dist/locuszoom.css","dev":"npm run css && webpack --watch --config webpack.dev.cjs","build":"npm run test && npm run css && webpack --config webpack.prod.cjs","docs":"jsdoc --recurse --readme ./README.md --destination jsdoc esm/ && pandoc -s --toc --css css/pandoc.css assets/docs/layout_tutorial.md -o docs/layout_tutorial.html"},"dependencies":{"d3":"^5.16.0"},"devDependencies":{"@babel/core":"^7.11.1","@babel/preset-env":"^7.11.0","@babel/register":"^7.10.5","babel-loader":"^8.1.0","babel-plugin-module-resolver":"^4.0.0","chai":"^4.2.0","clean-webpack-plugin":"^3.0.0","eslint":"^7.6.0","eslint-loader":"^4.0.2","friendly-errors-webpack-plugin":"^1.7.0","jsdoc":"^3.6.5","jsdom":"^16.4.0","jsdom-global":"^3.0.2","mocha":"~8.1.3","nyc":"^15.1.0","sass":"^1.26.10","sass-loader":"^8.0.2","sinon":"^6.3.5","source-map-loader":"^1.0.1","webpack":"^4.44.1","webpack-cli":"^3.3.12","webpack-merge":"^4.2.2"},"readme":"# LocusZoom\n\nLocusZoom is a Javascript/d3 embeddable plugin for interactively visualizing statistical genetic data from customizable\n sources.\n\n[](https://api.travis-ci.org/statgen/locuszoom)\n\nSee [github.com/statgen/locuszoom/wiki](https://github.com/statgen/locuszoom/wiki) for full documentation and API reference.\n\nTo see functional examples of plots generated with LocusZoom.js see [statgen.github.io/locuszoom](http://statgen.github.io/locuszoom/) \nand [statgen.github.io/locuszoom/#examples](http://statgen.github.io/locuszoom/#examples).\n\n\n\n## Making a LocusZoom Plot\n\n### 1. Include Necessary JavaScript and CSS\n\nThe page you build that embeds the LocusZoom plugin must include the following resources, found in the `dist` directory:\n\n* `d3.js` \n [D3.js](https://d3js.org/) v5.16.0 is used to draw graphics in LocusZoom plots. It may be loaded [via a CDN](https://cdn.jsdelivr.net/npm/d3@^5.16.0). It must be present before LocusZoom is loaded.\n\n* `locuszoom.app.min.js` \n This is the primary application logic. It should only be included *after* the vendor dependencies have been included. \n\n* `locuszoom.css` \n This is the primary stylesheet. It is namespaced so as not to conflict with any other styles defined on the same page.\n\nInstead of copying the files to your project, we recommend using CDN links are for these resources (see [statgen.github.io/locuszoom/](http://statgen.github.io/locuszoom/)).\n\n*The above instructions describe using LocusZoom with pure JS and HTML. If you are using a module build system, LocusZoom supports usage via ES6 imports, eg `import LocusZoom from 'locuszoom';` and `import 'locuszoom/dist/locuszoom.css';`* \n\n### 2. Define Data Sources\n\n**Data Sources** is an object representing a collection of arbitrarily many sources from which data for the plot can \nbe requested. When adding sources to the collection they must be namespaced so that retrieving specific fields can be \ndone with respect to specific data sources.\n\nHere's an example of defining a data sources object for a remote API:\n\n```javascript\nvar data_sources = new LocusZoom.DataSources();\ndata_sources.add(\"trait\", [\"AssociationLZ\", { url: \"http://server.com/api/\", params: {source: 1} }]);\n```\n\nThe above example adds an \"AssociationLZ\" data source (a predefined data source designed to make requests for \nassociation data) with a defined URL. The namespace for this data source is \"trait\".\n\nData sources can also be local files:\n\n```javascript\ndata_sources = new LocusZoom.DataSources();\ndata_sources.add(\"trait\", [\"AssociationLZ\", { url: \"file:///path/to/data.json\" }]);\n```\n\nRefer to the [Data Sources Documentation](https://github.com/statgen/locuszoom/wiki/Data-Sources) for more information \non using predefined data sources or extending/creating custom data sources.\n\n### 3. Define a Layout\n\n**Layout** is a serializable object that describes the configuration of the LocusZoom plot, including what data will be\n pulled from the data sources and displayed in what way, along with visual characteristics like color and geometry.\n\nA layout definition may look something like this:\n\n```javascript\nvar layout = {\n width: 500,\n height: 500,\n panels: [\n {\n id: \"association\",\n data_layers: [\n {\n id: \"association\",\n type: \"scatter\",\n fields: [\"trait:position\", \"trait:pvalue\"],\n x_axis: { field: \"trait:position\" },\n y_axis: { field: \"trait:pvalue\" }\n }\n ]\n }\n ]\n};\n```\n\nThe above example defines a basic plot that is 500 pixels on a side and has one panel with one scatter plot data layer\n that pulls in position and pvalue from the \"trait\" data source, mapping position to the x axis and pvalue to the y axis.\n\nThe LocusZoom.js library provides several pre-defined layouts for entire plots and subdivisions of plots such as panels,\n data layers, tool tips, etc. Refer to the [Layout Documentation](https://github.com/statgen/locuszoom/wiki/Layout) \n for more information.\n\n### 4. Put it Together with `LocusZoom.populate()`\n\nWith includes included, data sources defined, and a layout defined, `LocusZoom.populate()` will accept a CSS selector \nstring to populate the first matching element with a plot.\n\nA basic example may then look like this:\n\n```html\n\n \n \n \n \n \n \n \n \n\n```\n\n### Other Ways To Make a LocusZoom Plot\n\n#### Use a Predefined Layout\n\nThe core LocusZoom library comes equipped with several predefined layouts, organized by type (\"plot\", \"panel\", \n\"data_layer\", and \"toolbar\"). You can see what layouts are predefined by reading the contents of \n`assets/js/app/Layouts.js` or in the browser by entering `LocusZoom.Layouts.list()` (or to list one specific type: \n`LocusZoom.Layouts.list(type)`).\n\nGet any predefined layout by type and name using `LocusZoom.Layouts.get(type, name)`.\n \n#### Build a Layout Using Some Predefined Pieces\n\n`LocusZoom.Layouts.get(type, name)` can also be used to pull predefined layouts of smaller pieces, like data layers or \ntoolbars, into a custom layout:\n\n```javascript\nvar layout = {\n width: 1000,\n height: 500,\n panels: [\n LocusZoom.Layouts.get(\"panel\",\"gwas\"),\n {\n id: \"custom_panel\",\n ...\n },\n LocusZoom.Layouts.get(\"panel\",\"genes\")\n ]\n ...\n};\n```\n\n#### Modify a Predefined Layout\n\nThe `get()` function also accepts a partial layout to be merged with the predefined layout as a third argument, \nproviding the ability to use predefined layouts as starting points for custom layouts with only minor differences. Example:\n\n```javascript\nvar changes = {\n label_font_size: 20,\n transition: false\n};\nLocusZoom.Layouts.get(\"data_layer\", \"genes\", changes);\n```\n\n#### Predefining State by Building a State Object\n\n**State** is a serializable JSON object that describes orientation to specific data from data sources, and specific \ninteractions with the layout. This can include a specific query against various data sources or pre-selecting specific\n elements. Essentially, the state object is what tracks these types of user input under the hood in LocusZoom, and it \n can be predefined at initialization as a top-level parameter in the layout. For example:\n\n```javascript\nvar layout = LocusZoom.Layouts.get('plot', 'standard_association', { state: { chr: 6, start: 20379709, end: 20979709 } })\n```\n\n#### Predefining State With `data-region`\n\nYou can also describe the locus query aspect of the State (chromosome, start, and end position) using a `data-region`\n attribute of the containing element before populating it, like so:\n\n```html\n\n```\n\nWhen `LocusZoom.populate()` is executed on the element defined above it will automatically parse any `data-region` \nparameter to convert those values into the initial state.\n\n## Development Setup\n\n### Dependencies\n\nLocusZoom is an entirely client-side application designed to plug into arbitrary data sets, be they local files, APIs,\n or something else entirely. It has the following vendor dependencies:\n\n* [d3](http://d3js.org/) for a data visualization framework\n\n### Build System and Automated Testing\n\nLocusZoom is bundled using Webpack. To install all necessary dependencies for a development environment, run:\n\n```\n$ npm install\n```\n\nWe recommend using node.js v12 or greater to build the library and run tests.\n\nOnce complete run `npm run build` from the top of the application directory to run all tests and build the LocusZoom library bundle.\n\nThis build process will also write sourcemaps, to help with debugging code even in production environments.\n\n#### Other supported gulp commands:\n* `npm run test` - Run unit tests (optional: `npm run test:coverage` to output a code coverage report)\n* `npm run dev` - Automatically rebuild the library whenever code changes (development mode)\n* `npm run build` - Run tests, and if they pass, build the library for release\n* `npm run css` - Rebuild the CSS using SASS\n* `npm run docs` - Build the library documentation\n\n\n#### Automated Testing\n\nLocusZoom uses [Mocha](https://mochajs.org/) for unit testing. Tests are located in the `test` subdirectory.\n\n### Linting\nLocusZoom is also linted using \n[ESLint](http://eslint.org/), the rules for which can be found in `.eslintrc`. This will run automatically as part of all new code commits, and during every build. \n\n## Help and Support\n\nFull documentation can be found here: [github.com/statgen/locuszoom/wiki](https://github.com/statgen/locuszoom/wiki)\n\nA LocusZoom discussion forum is available here: [groups.google.com/forum/#!forum/locuszoom](https://groups.google.com/forum/#!forum/locuszoom). \nFor the most effective help, please specify that your question is about \"LocusZoom.js\".\n\nIf you have questions or feedback please file an issue on the [LocusZoom.js GitHub repository](https://github.com/statgen/locuszoom/issues) or post at the discussion forum referenced above.\n","readmeFilename":"README.md","gitHead":"3c2cb69bd02485ef93a0fcf88cc19513ce8862ab","bugs":{"url":"https://github.com/statgen/locuszoom/issues"},"_id":"locuszoom@0.13.0-beta.1","_nodeVersion":"12.18.0","_npmVersion":"6.14.4","dist":{"integrity":"sha512-NkvIWrpiPkuf4s//2oKquUSKuueVNU878laUBxkrrfdbNjhdsCTehMYnhwYkdY0MzulCxh3g2ImoDBVXuGH1BA==","shasum":"7930f411beb964ec2e99d26ddb6e3546ed03a7f1","tarball":"https://registry.npmjs.org/locuszoom/-/locuszoom-0.13.0-beta.1.tgz","fileCount":143,"unpackedSize":4590864,"npm-signature":"-----BEGIN PGP SIGNATURE-----\r\nVersion: OpenPGP.js v3.0.13\r\nComment: https://openpgpjs.org\r\n\r\nwsFcBAEBCAAQBQJfiGxvCRA9TVsSAnZWagAAWq8P/19/szThhle7wlj3iYgg\nTUEGlhJYVmymh66YBVL6RKkZO1ahIxa+4R0LhkzwzT52ZWMajciGHZDOl+rE\nvmOJqPyQkCjMCDeN3fWc1/boSLQRVBrLdaB7NJB2dVj/+LzVOz89b7S1wwzH\nCFORIdPY588tsAsmecOmb1CRRAGl8C21UQc7ZMS1+/Cf3CWonzcpvkZpYrWZ\nSlTNJi3lcZevyTNAoFs/Db3BPWW9xT9H8gycsemeVeJ6HVCi9AXrNZj7yG1j\nDfAGs6v+hzwbqilj8t7QVXhvLy0S2aY94AftLm/wtDs/zJLDCBvtVHIajcOe\n96O0ToaiholvqiITufjRNtLSkHsbnjTTq256rAt7hX5I85X7jzZTXcT2Bs5N\ny2u5Mdva8Nx48X65y+68AhulMwd4ws54OH+/KrqKbN1FzjsDztnRw5ipmeoD\n1KD8dA1FgXCH5VmjvQD2LxUny/yR2yth4Gl+mNni/MliOQzbvpzVTSNPcohj\nXwjcZqb2ziJJe8rdEUN9Kc0pOefzUEC9BKAzAVUC29zponvT32aW8e2Uv+iq\nLux3CEw7pp615aHCCNxmrdly6xxP3ginE+jrgn3sZ0SLS0t3YLi+tHr0mR/a\nJo9g8cZRd++Nav8wrMTNly9l+k2Dp6WsoMko1abMzK7mvlSHCmEL67MhrqTR\nUHiF\r\n=J3Y6\r\n-----END PGP SIGNATURE-----\r\n","signatures":[{"keyid":"SHA256:jl3bwswu80PjjokCgh0o2w5c2U4LhQAE57gj9cz1kzA","sig":"MEUCIAXAUOAkGxAxDfDrxUtldX3lCeMUY/wcq8dLntyJMyTTAiEAyI7ViaqcXdfPoIQzQdOXDISv6LddfpuHkibZ0ZkowVA="}]},"maintainers":[{"name":"frencil","email":"frencils@gmail.com"},{"name":"abought","email":"abought@gmail.com"},{"name":"welchr","email":"welchr@umich.edu"}],"_npmUser":{"name":"abought","email":"abought@gmail.com"},"directories":{},"_npmOperationalInternal":{"host":"s3://npm-registry-packages","tmp":"tmp/locuszoom_0.13.0-beta.1_1602776175151_0.45335390462265135"},"_hasShrinkwrap":false},"0.13.0-beta.2":{"name":"locuszoom","version":"0.13.0-beta.2","main":"dist/locuszoom.app.min.js","module":"esm/index.js","sideEffects":true,"description":"Generate interactive visualizations of statistical genetic data","keywords":["visualization","genetics","genes","gwas","phewas"],"homepage":"http://locuszoom.org","license":"MIT","author":{"name":"University of Michigan Center for Statistical Genetics"},"contributors":[{"name":"Christopher Clark"},{"name":"Matthew Flickinger"},{"name":"Ryan Welch"},{"name":"Peter VandeHaar"},{"name":"Andy Boughton","email":"abought@umich.edu"}],"engines":{"node":">=10.13.0"},"repository":{"type":"git","url":"git+https://github.com/statgen/locuszoom.git"},"scripts":{"echo_version":"echo \"export default '${npm_package_version}';\" > esm/version.js","test":"eslint esm/ test/ && mocha --recursive test","test:coverage":"nyc --reporter=text mocha --recursive test/**/*.js","css":"sass --style compressed ./css/locuszoom.scss ./dist/locuszoom.css","dev":"npm run css && webpack --watch --config webpack.dev.cjs","build":"npm run echo_version && npm run test && npm run css && webpack --config webpack.prod.cjs","docs":"jsdoc --recurse --readme ./README.md --destination jsdoc esm/ && pandoc -s --toc --css css/pandoc.css assets/docs/layout_tutorial.md -o docs/layout_tutorial.html"},"dependencies":{"d3":"^5.16.0"},"devDependencies":{"@babel/core":"^7.11.1","@babel/preset-env":"^7.11.0","@babel/register":"^7.10.5","babel-loader":"^8.1.0","babel-plugin-module-resolver":"^4.0.0","chai":"^4.2.0","clean-webpack-plugin":"^3.0.0","eslint":"^7.6.0","eslint-loader":"^4.0.2","friendly-errors-webpack-plugin":"^1.7.0","jsdoc":"^3.6.5","jsdom":"^16.4.0","jsdom-global":"^3.0.2","mocha":"~8.1.3","nyc":"^15.1.0","sass":"^1.26.10","sass-loader":"^8.0.2","sinon":"^6.3.5","source-map-loader":"^1.0.1","webpack":"^4.44.1","webpack-cli":"^3.3.12","webpack-merge":"^4.2.2"},"readme":"# LocusZoom\n\nLocusZoom is a Javascript/d3 embeddable plugin for interactively visualizing statistical genetic data from customizable\n sources.\n\n[](https://api.travis-ci.org/statgen/locuszoom)\n\nSee [github.com/statgen/locuszoom/wiki](https://github.com/statgen/locuszoom/wiki) for full documentation and API reference.\n\nTo see functional examples of plots generated with LocusZoom.js see [statgen.github.io/locuszoom](http://statgen.github.io/locuszoom/) \nand [statgen.github.io/locuszoom/#examples](http://statgen.github.io/locuszoom/#examples).\n\n\n\n## Making a LocusZoom Plot\n\n### 1. Include Necessary JavaScript and CSS\n\nThe page you build that embeds the LocusZoom plugin must include the following resources, found in the `dist` directory:\n\n* `d3.js` \n [D3.js](https://d3js.org/) v5.16.0 is used to draw graphics in LocusZoom plots. It may be loaded [via a CDN](https://cdn.jsdelivr.net/npm/d3@^5.16.0). It must be present before LocusZoom is loaded.\n\n* `locuszoom.app.min.js` \n This is the primary application logic. It should only be included *after* the vendor dependencies have been included. \n\n* `locuszoom.css` \n This is the primary stylesheet. It is namespaced so as not to conflict with any other styles defined on the same page.\n\nInstead of copying the files to your project, we recommend using CDN links are for these resources (see [statgen.github.io/locuszoom/](http://statgen.github.io/locuszoom/)).\n\n*The above instructions describe using LocusZoom with pure JS and HTML. If you are using a module build system, LocusZoom supports usage via ES6 imports, eg `import LocusZoom from 'locuszoom';` and `import 'locuszoom/dist/locuszoom.css';`* \n\n### 2. Define Data Sources\n\n**Data Sources** is an object representing a collection of arbitrarily many sources from which data for the plot can \nbe requested. When adding sources to the collection they must be namespaced so that retrieving specific fields can be \ndone with respect to specific data sources.\n\nHere's an example of defining a data sources object for a remote API:\n\n```javascript\nvar data_sources = new LocusZoom.DataSources();\ndata_sources.add(\"trait\", [\"AssociationLZ\", { url: \"http://server.com/api/\", params: {source: 1} }]);\n```\n\nThe above example adds an \"AssociationLZ\" data source (a predefined data source designed to make requests for \nassociation data) with a defined URL. The namespace for this data source is \"trait\".\n\nData sources can also be local files:\n\n```javascript\ndata_sources = new LocusZoom.DataSources();\ndata_sources.add(\"trait\", [\"AssociationLZ\", { url: \"file:///path/to/data.json\" }]);\n```\n\nRefer to the [Data Sources Documentation](https://github.com/statgen/locuszoom/wiki/Data-Sources) for more information \non using predefined data sources or extending/creating custom data sources.\n\n### 3. Define a Layout\n\n**Layout** is a serializable object that describes the configuration of the LocusZoom plot, including what data will be\n pulled from the data sources and displayed in what way, along with visual characteristics like color and geometry.\n\nA layout definition may look something like this:\n\n```javascript\nvar layout = {\n width: 500,\n height: 500,\n panels: [\n {\n id: \"association\",\n data_layers: [\n {\n id: \"association\",\n type: \"scatter\",\n fields: [\"trait:position\", \"trait:pvalue\"],\n x_axis: { field: \"trait:position\" },\n y_axis: { field: \"trait:pvalue\" }\n }\n ]\n }\n ]\n};\n```\n\nThe above example defines a basic plot that is 500 pixels on a side and has one panel with one scatter plot data layer\n that pulls in position and pvalue from the \"trait\" data source, mapping position to the x axis and pvalue to the y axis.\n\nThe LocusZoom.js library provides several pre-defined layouts for entire plots and subdivisions of plots such as panels,\n data layers, tool tips, etc. Refer to the [Layout Documentation](https://github.com/statgen/locuszoom/wiki/Layout) \n for more information.\n\n### 4. Put it Together with `LocusZoom.populate()`\n\nWith includes included, data sources defined, and a layout defined, `LocusZoom.populate()` will accept a CSS selector \nstring to populate the first matching element with a plot.\n\nA basic example may then look like this:\n\n```html\n\n \n \n \n \n \n \n \n \n\n```\n\n### Other Ways To Make a LocusZoom Plot\n\n#### Use a Predefined Layout\n\nThe core LocusZoom library comes equipped with several predefined layouts, organized by type (\"plot\", \"panel\", \n\"data_layer\", and \"toolbar\"). You can see what layouts are predefined by reading the contents of \n`assets/js/app/Layouts.js` or in the browser by entering `LocusZoom.Layouts.list()` (or to list one specific type: \n`LocusZoom.Layouts.list(type)`).\n\nGet any predefined layout by type and name using `LocusZoom.Layouts.get(type, name)`.\n \n#### Build a Layout Using Some Predefined Pieces\n\n`LocusZoom.Layouts.get(type, name)` can also be used to pull predefined layouts of smaller pieces, like data layers or \ntoolbars, into a custom layout:\n\n```javascript\nvar layout = {\n width: 1000,\n height: 500,\n panels: [\n LocusZoom.Layouts.get(\"panel\",\"gwas\"),\n {\n id: \"custom_panel\",\n ...\n },\n LocusZoom.Layouts.get(\"panel\",\"genes\")\n ]\n ...\n};\n```\n\n#### Modify a Predefined Layout\n\nThe `get()` function also accepts a partial layout to be merged with the predefined layout as a third argument, \nproviding the ability to use predefined layouts as starting points for custom layouts with only minor differences. Example:\n\n```javascript\nvar changes = {\n label_font_size: 20,\n transition: false\n};\nLocusZoom.Layouts.get(\"data_layer\", \"genes\", changes);\n```\n\n#### Predefining State by Building a State Object\n\n**State** is a serializable JSON object that describes orientation to specific data from data sources, and specific \ninteractions with the layout. This can include a specific query against various data sources or pre-selecting specific\n elements. Essentially, the state object is what tracks these types of user input under the hood in LocusZoom, and it \n can be predefined at initialization as a top-level parameter in the layout. For example:\n\n```javascript\nvar layout = LocusZoom.Layouts.get('plot', 'standard_association', { state: { chr: 6, start: 20379709, end: 20979709 } })\n```\n\n#### Predefining State With `data-region`\n\nYou can also describe the locus query aspect of the State (chromosome, start, and end position) using a `data-region`\n attribute of the containing element before populating it, like so:\n\n```html\n\n```\n\nWhen `LocusZoom.populate()` is executed on the element defined above it will automatically parse any `data-region` \nparameter to convert those values into the initial state.\n\n## Development Setup\n\n### Dependencies\n\nLocusZoom is an entirely client-side application designed to plug into arbitrary data sets, be they local files, APIs,\n or something else entirely. It has the following vendor dependencies:\n\n* [d3](http://d3js.org/) for a data visualization framework\n\n### Build System and Automated Testing\n\nLocusZoom is bundled using Webpack. To install all necessary dependencies for a development environment, run:\n\n```\n$ npm install\n```\n\nWe recommend using node.js v12 or greater to build the library and run tests.\n\nOnce complete run `npm run build` from the top of the application directory to run all tests and build the LocusZoom library bundle.\n\nThis build process will also write sourcemaps, to help with debugging code even in production environments.\n\n#### Other supported gulp commands:\n* `npm run test` - Run unit tests (optional: `npm run test:coverage` to output a code coverage report)\n* `npm run dev` - Automatically rebuild the library whenever code changes (development mode)\n* `npm run build` - Run tests, and if they pass, build the library for release\n* `npm run css` - Rebuild the CSS using SASS\n* `npm run docs` - Build the library documentation\n\n\n#### Automated Testing\n\nLocusZoom uses [Mocha](https://mochajs.org/) for unit testing. Tests are located in the `test` subdirectory.\n\n### Linting\nLocusZoom is also linted using \n[ESLint](http://eslint.org/), the rules for which can be found in `.eslintrc`. This will run automatically as part of all new code commits, and during every build. \n\n## Help and Support\n\nFull documentation can be found here: [github.com/statgen/locuszoom/wiki](https://github.com/statgen/locuszoom/wiki)\n\nA LocusZoom discussion forum is available here: [groups.google.com/forum/#!forum/locuszoom](https://groups.google.com/forum/#!forum/locuszoom). \nFor the most effective help, please specify that your question is about \"LocusZoom.js\".\n\nIf you have questions or feedback please file an issue on the [LocusZoom.js GitHub repository](https://github.com/statgen/locuszoom/issues) or post at the discussion forum referenced above.\n","readmeFilename":"README.md","gitHead":"4392b5dbfbcf495c4f3a20554535b097cd7611bd","bugs":{"url":"https://github.com/statgen/locuszoom/issues"},"_id":"locuszoom@0.13.0-beta.2","_nodeVersion":"12.18.0","_npmVersion":"6.14.4","dist":{"integrity":"sha512-0n2SYNS0Lb6FRV46gcjdXSw7BcL2unURsdBSzumn3TSu8wrd80SYKq5m1M2+fPMqQg/yn7HGhI2G14dQQ8gmQA==","shasum":"0c395cdbfd2a87c7038200e3cd5ab4531c3eab6d","tarball":"https://registry.npmjs.org/locuszoom/-/locuszoom-0.13.0-beta.2.tgz","fileCount":144,"unpackedSize":4173074,"npm-signature":"-----BEGIN PGP SIGNATURE-----\r\nVersion: OpenPGP.js v3.0.13\r\nComment: https://openpgpjs.org\r\n\r\nwsFcBAEBCAAQBQJfmGl9CRA9TVsSAnZWagAAAf8P/0QN3s1CMNW8vuFMbdzQ\n3sdXMeDzM3+5geEoNvXcLjMSGFwDg2APObRaH0V9CfSkjspJy2wfSlZOVhVI\nul1SOhHsq0D755/gAiKnkFL2lT63v6NMiXvGlfKFdmZB7OsdpIhyxG604rbc\nq+JH770eto1ImzSeFHSdsHoQhJP5RNIZvZPY0djO5aSbrV6WGYogYHr2pBrj\nicXpefVUBRTH7b5LLnCC9MZRP3Eub20dCz7kV4o8/TcTEjI2Ycpr4gwTq961\nPqRprAJ3cbN34qNqq3reY9P7b9KLJpVWUiD/2TgrY+z88s68c5sMFu0efSd0\nnZBelcsSFO1vwfLwzcyj2PwjNqImBL8DnsLHXXDHnX/eQI3Wfk5qfiWXT6i5\n97puI7r7IHmeE3clLfonK6fQJLg8nTxmQGnC2c7XpR8F3typS9eMBamzL7/r\nwyGEdKdWlrWPmF3OdgBgUXDW60kHdWznat23ohQFJFVP/FlCugKUx6B4PDN9\n5+tz44EFxd+zS3lsK3pRQ5DvJx8zaUpl38rNh2rFMoErGnQisC2bFYN6HRaK\nZiVBxNHcoJ9uS37uEdb93yOaiASCNM7qMK6EAvHETNTz0sO6khf3chnIP9b5\nHUvcQ5vA+Gg/JfSfK8TH7Z9pPM7OkgMOCghPG6+S/pTyboAmClZCsos47yfv\n1+gE\r\n=Cj0L\r\n-----END PGP SIGNATURE-----\r\n","signatures":[{"keyid":"SHA256:jl3bwswu80PjjokCgh0o2w5c2U4LhQAE57gj9cz1kzA","sig":"MEUCIQCTm18SE6PvieiTtYNb2H7lqGbuEorIrwTDGCX814K5dgIgfrUN7Y4CklUHZo/hQ+7mXRR29sO48/KoU/Ev2O60htM="}]},"maintainers":[{"name":"frencil","email":"frencils@gmail.com"},{"name":"abought","email":"abought@gmail.com"},{"name":"welchr","email":"welchr@umich.edu"}],"_npmUser":{"name":"abought","email":"abought@gmail.com"},"directories":{},"_npmOperationalInternal":{"host":"s3://npm-registry-packages","tmp":"tmp/locuszoom_0.13.0-beta.2_1603823996999_0.037108258882903034"},"_hasShrinkwrap":false},"0.13.0-beta.3":{"name":"locuszoom","version":"0.13.0-beta.3","main":"dist/locuszoom.app.min.js","module":"esm/index.js","sideEffects":true,"description":"Generate interactive visualizations of statistical genetic data","keywords":["visualization","genetics","genes","gwas","phewas"],"homepage":"http://locuszoom.org","license":"MIT","author":{"name":"University of Michigan Center for Statistical Genetics"},"contributors":[{"name":"Christopher Clark"},{"name":"Matthew Flickinger"},{"name":"Ryan Welch"},{"name":"Peter VandeHaar"},{"name":"Andy Boughton","email":"abought@umich.edu"}],"engines":{"node":">=10.13.0"},"repository":{"type":"git","url":"git+https://github.com/statgen/locuszoom.git"},"scripts":{"echo_version":"echo \"export default '${npm_package_version}';\" > esm/version.js","test":"eslint esm/ test/ && mocha --recursive test","test:coverage":"nyc --reporter=text mocha --recursive test/**/*.js","css":"sass --style compressed ./css/locuszoom.scss ./dist/locuszoom.css","dev":"npm run css && webpack --watch --config webpack.dev.cjs","build":"npm run echo_version && npm run test && npm run css && webpack --config webpack.prod.cjs","docs":"jsdoc --recurse --readme ./README.md --destination jsdoc esm/ && pandoc -s --toc --css css/pandoc.css assets/docs/layout_tutorial.md -o docs/layout_tutorial.html"},"dependencies":{"d3":"^5.16.0"},"devDependencies":{"@babel/core":"^7.12.10","@babel/preset-env":"^7.12.0","@babel/register":"^7.12.10","babel-loader":"^8.2.2","babel-plugin-module-resolver":"^4.0.0","chai":"^4.2.0","clean-webpack-plugin":"^3.0.0","eslint":"^7.15.0","eslint-webpack-plugin":"^2.4.1","friendly-errors-webpack-plugin":"^1.7.0","jsdoc":"^3.6.6","jsdom":"^16.4.0","jsdom-global":"^3.0.2","mocha":"~8.2.1","nyc":"^15.1.0","sass":"^1.30.0","sass-loader":"^10.1.0","sinon":"^6.3.5","source-map-loader":"^1.1.3","webpack":"^4.44.1","webpack-cli":"^3.3.12","webpack-merge":"^4.2.2"},"readme":"# LocusZoom\n\nLocusZoom is a Javascript/d3 embeddable plugin for interactively visualizing statistical genetic data from customizable\n sources.\n\n\n\nSee [github.com/statgen/locuszoom/wiki](https://github.com/statgen/locuszoom/wiki) for full documentation and API reference.\n\nTo see functional examples of plots generated with LocusZoom.js see [statgen.github.io/locuszoom](http://statgen.github.io/locuszoom/) \nand [statgen.github.io/locuszoom/#examples](http://statgen.github.io/locuszoom/#examples).\n\n\n\n## Making a LocusZoom Plot\n\n### 1. Include Necessary JavaScript and CSS\n\nThe page you build that embeds the LocusZoom plugin must include the following resources, found in the `dist` directory:\n\n* `d3.js` \n [D3.js](https://d3js.org/) v5.16.0 is used to draw graphics in LocusZoom plots. It may be loaded [via a CDN](https://cdn.jsdelivr.net/npm/d3@^5.16.0). It must be present before LocusZoom is loaded.\n\n* `locuszoom.app.min.js` \n This is the primary application logic. It should only be included *after* the vendor dependencies have been included. \n\n* `locuszoom.css` \n This is the primary stylesheet. It is namespaced so as not to conflict with any other styles defined on the same page.\n\nInstead of copying the files to your project, we recommend using CDN links are for these resources (see [statgen.github.io/locuszoom/](http://statgen.github.io/locuszoom/)).\n\n*The above instructions describe using LocusZoom with pure JS and HTML. If you are using a module build system, LocusZoom supports usage via ES6 imports, eg `import LocusZoom from 'locuszoom';` and `import 'locuszoom/dist/locuszoom.css';`* \n\n### 2. Define Data Sources\n\n**Data Sources** is an object representing a collection of arbitrarily many sources from which data for the plot can \nbe requested. When adding sources to the collection they must be namespaced so that retrieving specific fields can be \ndone with respect to specific data sources.\n\nHere's an example of defining a data sources object for a remote API:\n\n```javascript\nvar data_sources = new LocusZoom.DataSources();\ndata_sources.add(\"trait\", [\"AssociationLZ\", { url: \"http://server.com/api/\", params: {source: 1} }]);\n```\n\nThe above example adds an \"AssociationLZ\" data source (a predefined data source designed to make requests for \nassociation data) with a defined URL. The namespace for this data source is \"trait\".\n\nData sources can also be local files:\n\n```javascript\ndata_sources = new LocusZoom.DataSources();\ndata_sources.add(\"trait\", [\"AssociationLZ\", { url: \"file:///path/to/data.json\" }]);\n```\n\nRefer to the [Data Sources Documentation](https://github.com/statgen/locuszoom/wiki/Data-Sources) for more information \non using predefined data sources or extending/creating custom data sources.\n\n### 3. Define a Layout\n\n**Layout** is a serializable object that describes the configuration of the LocusZoom plot, including what data will be\n pulled from the data sources and displayed in what way, along with visual characteristics like color and geometry.\n\nA layout definition may look something like this:\n\n```javascript\nvar layout = {\n width: 500,\n height: 500,\n panels: [\n {\n id: \"association\",\n data_layers: [\n {\n id: \"association\",\n type: \"scatter\",\n fields: [\"trait:position\", \"trait:pvalue\"],\n x_axis: { field: \"trait:position\" },\n y_axis: { field: \"trait:pvalue\" }\n }\n ]\n }\n ]\n};\n```\n\nThe above example defines a basic plot that is 500 pixels on a side and has one panel with one scatter plot data layer\n that pulls in position and pvalue from the \"trait\" data source, mapping position to the x axis and pvalue to the y axis.\n\nThe LocusZoom.js library provides several pre-defined layouts for entire plots and subdivisions of plots such as panels,\n data layers, tool tips, etc. Refer to the [Layout Documentation](https://github.com/statgen/locuszoom/wiki/Layout) \n for more information.\n\n### 4. Put it Together with `LocusZoom.populate()`\n\nWith includes included, data sources defined, and a layout defined, `LocusZoom.populate()` will accept a CSS selector \nstring to populate the first matching element with a plot.\n\nA basic example may then look like this:\n\n```html\n\n \n \n \n \n \n \n \n \n\n```\n\n### Other Ways To Make a LocusZoom Plot\n\n#### Use a Predefined Layout\n\nThe core LocusZoom library comes equipped with several predefined layouts, organized by type (\"plot\", \"panel\", \n\"data_layer\", and \"toolbar\"). You can see what layouts are predefined by reading the contents of \n`assets/js/app/Layouts.js` or in the browser by entering `LocusZoom.Layouts.list()` (or to list one specific type: \n`LocusZoom.Layouts.list(type)`).\n\nGet any predefined layout by type and name using `LocusZoom.Layouts.get(type, name)`.\n \n#### Build a Layout Using Some Predefined Pieces\n\n`LocusZoom.Layouts.get(type, name)` can also be used to pull predefined layouts of smaller pieces, like data layers or \ntoolbars, into a custom layout:\n\n```javascript\nvar layout = {\n width: 1000,\n height: 500,\n panels: [\n LocusZoom.Layouts.get(\"panel\",\"gwas\"),\n {\n id: \"custom_panel\",\n ...\n },\n LocusZoom.Layouts.get(\"panel\",\"genes\")\n ]\n ...\n};\n```\n\n#### Modify a Predefined Layout\n\nThe `get()` function also accepts a partial layout to be merged with the predefined layout as a third argument, \nproviding the ability to use predefined layouts as starting points for custom layouts with only minor differences. Example:\n\n```javascript\nvar changes = {\n label_font_size: 20,\n transition: false\n};\nLocusZoom.Layouts.get(\"data_layer\", \"genes\", changes);\n```\n\n#### Predefining State by Building a State Object\n\n**State** is a serializable JSON object that describes orientation to specific data from data sources, and specific \ninteractions with the layout. This can include a specific query against various data sources or pre-selecting specific\n elements. Essentially, the state object is what tracks these types of user input under the hood in LocusZoom, and it \n can be predefined at initialization as a top-level parameter in the layout. For example:\n\n```javascript\nvar layout = LocusZoom.Layouts.get('plot', 'standard_association', { state: { chr: 6, start: 20379709, end: 20979709 } })\n```\n\n#### Predefining State With `data-region`\n\nYou can also describe the locus query aspect of the State (chromosome, start, and end position) using a `data-region`\n attribute of the containing element before populating it, like so:\n\n```html\n\n```\n\nWhen `LocusZoom.populate()` is executed on the element defined above it will automatically parse any `data-region` \nparameter to convert those values into the initial state.\n\n## Development Setup\n\n### Dependencies\n\nLocusZoom is an entirely client-side application designed to plug into arbitrary data sets, be they local files, APIs,\n or something else entirely. It has the following vendor dependencies:\n\n* [d3](http://d3js.org/) for a data visualization framework\n\n### Build System and Automated Testing\n\nLocusZoom is bundled using Webpack. To install all necessary dependencies for a development environment, run:\n\n```\n$ npm install\n```\n\nWe recommend using node.js v12 or greater to build the library and run tests.\n\nOnce complete run `npm run build` from the top of the application directory to run all tests and build the LocusZoom library bundle.\n\nThis build process will also write sourcemaps, to help with debugging code even in production environments.\n\n#### Other supported gulp commands:\n* `npm run test` - Run unit tests (optional: `npm run test:coverage` to output a code coverage report)\n* `npm run dev` - Automatically rebuild the library whenever code changes (development mode)\n* `npm run build` - Run tests, and if they pass, build the library for release\n* `npm run css` - Rebuild the CSS using SASS\n* `npm run docs` - Build the library documentation\n\n\n#### Automated Testing\n\nLocusZoom uses [Mocha](https://mochajs.org/) for unit testing. Tests are located in the `test` subdirectory.\n\n### Linting\nLocusZoom is also linted using \n[ESLint](http://eslint.org/), the rules for which can be found in `.eslintrc`. This will run automatically as part of all new code commits, and during every build. \n\n## Help and Support\n\nFull documentation can be found here: [github.com/statgen/locuszoom/wiki](https://github.com/statgen/locuszoom/wiki)\n\nA LocusZoom discussion forum is available here: [groups.google.com/forum/#!forum/locuszoom](https://groups.google.com/forum/#!forum/locuszoom). \nFor the most effective help, please specify that your question is about \"LocusZoom.js\".\n\nIf you have questions or feedback please file an issue on the [LocusZoom.js GitHub repository](https://github.com/statgen/locuszoom/issues) or post at the discussion forum referenced above.\n","readmeFilename":"README.md","gitHead":"dfac174ec6e34e738ccd7711eefa93b79a43c044","bugs":{"url":"https://github.com/statgen/locuszoom/issues"},"_id":"locuszoom@0.13.0-beta.3","_nodeVersion":"12.20.0","_npmVersion":"6.14.8","dist":{"integrity":"sha512-n6audVWcwvqFwRsOhRWio+e82h/TnlJFlF/Bt0N+g275acfHlio2vFZY8YWxh2PMY4iwTj2C/m2Y2Wvp6R7iMA==","shasum":"246faa725f52e60f3f12f4df849726b1f356089d","tarball":"https://registry.npmjs.org/locuszoom/-/locuszoom-0.13.0-beta.3.tgz","fileCount":146,"unpackedSize":4111989,"npm-signature":"-----BEGIN PGP SIGNATURE-----\r\nVersion: OpenPGP.js v3.0.13\r\nComment: https://openpgpjs.org\r\n\r\nwsFcBAEBCAAQBQJf06aQCRA9TVsSAnZWagAAye0QAI314AuCZZAq9DO1ZPUc\nZvF3l+qeRItffDQNj+iXa5GF68y51vpIZfrzeBswFcsM4QcZfGIWQuYGWHsm\nteGF8HIv8pKIVJ/UW8/Z75eaDp92HBMhCjeOoUTdFMrFdfI+qngzjZxtkyBv\no3LhoOS/EH6FEEfvhDbVCRbvtMm3C9L92guHP0HIpbrzTF+xdx4Cj+itcDbh\nZUtRlv//U8DV93xq9W2619+H1/ZWwsAlzsR0Vc7jz5RNmz1sun+PKS4ZknR6\nlK1k5rYwmU+f1U3pe+6PO4GcKVvV0S8XQQOtYPbuktBb9U0hr6zgpmlcVR13\nPwsgGohqGjCN01qMhQFPcCXxtHWuZqmzUt0y5XxUq6kG0yP36MgYQKUjh151\nvvDhAIY2pVr8W099dPnSd/ViCnLrWjRjiqqQjzXHVAMvPE0Me8q5+tEXfgnU\n5q1nY0H0FYuZWNDQraBjSbvUUkiyC2pDGSTbUG8n7Du5/TekxqNvQeGU4jmS\nsRzng+pLeNZlEDAZX3s+cuMo4tFdd/6qXKrW7xRF9TFfodztLSIC1Q3pM197\npvxACp3vo34Jl7qguMRwLkuvUctkTyY2A4Y/OLmauE8tYIpYw46Pkzn7HP4M\nQqiMFeR12DxGesf+RkNP7AHgRnarXW5P6QjKVQLZ8WnPCupLkkdOWVpufs6I\nS8TB\r\n=EG7f\r\n-----END PGP SIGNATURE-----\r\n","signatures":[{"keyid":"SHA256:jl3bwswu80PjjokCgh0o2w5c2U4LhQAE57gj9cz1kzA","sig":"MEYCIQCK2EkEPuFXUd49YuM10n/cOMAxZ6Za/9ia4Qo4wHPAcgIhAKN5m6IV9NgfJiN3tys1VReEgvdHVFYUydOrtKXkPQkK"}]},"_npmUser":{"name":"abought","email":"abought@gmail.com"},"directories":{},"maintainers":[{"name":"frencil","email":"frencils@gmail.com"},{"name":"abought","email":"abought@gmail.com"},{"name":"welchr","email":"welchr@umich.edu"}],"_npmOperationalInternal":{"host":"s3://npm-registry-packages","tmp":"tmp/locuszoom_0.13.0-beta.3_1607706256256_0.4025671476355561"},"_hasShrinkwrap":false},"0.13.0-beta.4":{"name":"locuszoom","version":"0.13.0-beta.4","main":"dist/locuszoom.app.min.js","module":"esm/index.js","sideEffects":true,"description":"Generate interactive visualizations of statistical genetic data","keywords":["visualization","genetics","genes","gwas","phewas"],"homepage":"http://locuszoom.org","license":"MIT","author":{"name":"University of Michigan Center for Statistical Genetics"},"contributors":[{"name":"Christopher Clark"},{"name":"Matthew Flickinger"},{"name":"Ryan Welch"},{"name":"Peter VandeHaar"},{"name":"Andy Boughton","email":"abought@umich.edu"}],"engines":{"node":">=10.13.0"},"repository":{"type":"git","url":"git+https://github.com/statgen/locuszoom.git"},"scripts":{"echo_version":"echo \"export default '${npm_package_version}';\" > esm/version.js","test":"eslint esm/ test/ && mocha --recursive test","test:coverage":"nyc --reporter=text mocha --recursive test/**/*.js","css":"sass --style compressed ./css/locuszoom.scss ./dist/locuszoom.css","dev":"npm run css && webpack --watch --config webpack.dev.cjs","build":"npm run echo_version && npm run test && npm run css && webpack --config webpack.prod.cjs","docs":"jsdoc --recurse --readme ./README.md --destination jsdoc esm/ && pandoc -s --toc --css css/pandoc.css assets/docs/layout_tutorial.md -o docs/layout_tutorial.html"},"dependencies":{"d3":"^5.16.0"},"devDependencies":{"@babel/core":"^7.12.10","@babel/preset-env":"^7.12.0","@babel/register":"^7.12.10","babel-loader":"^8.2.2","babel-plugin-module-resolver":"^4.0.0","chai":"^4.2.0","clean-webpack-plugin":"^3.0.0","eslint":"^7.15.0","eslint-webpack-plugin":"^2.4.1","friendly-errors-webpack-plugin":"^1.7.0","jsdoc":"^3.6.6","jsdom":"^16.4.0","jsdom-global":"^3.0.2","mocha":"~8.2.1","nyc":"^15.1.0","sass":"^1.30.0","sass-loader":"^10.1.0","sinon":"^6.3.5","source-map-loader":"^1.1.3","webpack":"^4.44.1","webpack-cli":"^3.3.12","webpack-merge":"^4.2.2"},"readme":"# LocusZoom\n\nLocusZoom is a Javascript/d3 embeddable plugin for interactively visualizing statistical genetic data from customizable\n sources.\n\n\n\nSee [github.com/statgen/locuszoom/wiki](https://github.com/statgen/locuszoom/wiki) for full documentation and API reference.\n\nTo see functional examples of plots generated with LocusZoom.js see [statgen.github.io/locuszoom](http://statgen.github.io/locuszoom/) \nand [statgen.github.io/locuszoom/#examples](http://statgen.github.io/locuszoom/#examples).\n\n\n\n## Making a LocusZoom Plot\n\n### 1. Include Necessary JavaScript and CSS\n\nThe page you build that embeds the LocusZoom plugin must include the following resources, found in the `dist` directory:\n\n* `d3.js` \n [D3.js](https://d3js.org/) v5.16.0 is used to draw graphics in LocusZoom plots. It may be loaded [via a CDN](https://cdn.jsdelivr.net/npm/d3@^5.16.0). It must be present before LocusZoom is loaded.\n\n* `locuszoom.app.min.js` \n This is the primary application logic. It should only be included *after* the vendor dependencies have been included. \n\n* `locuszoom.css` \n This is the primary stylesheet. It is namespaced so as not to conflict with any other styles defined on the same page.\n\nInstead of copying the files to your project, we recommend using CDN links are for these resources (see [statgen.github.io/locuszoom/](http://statgen.github.io/locuszoom/)).\n\n*The above instructions describe using LocusZoom with pure JS and HTML. If you are using a module build system, LocusZoom supports usage via ES6 imports, eg `import LocusZoom from 'locuszoom';` and `import 'locuszoom/dist/locuszoom.css';`* \n\n### 2. Define Data Sources\n\n**Data Sources** is an object representing a collection of arbitrarily many sources from which data for the plot can \nbe requested. When adding sources to the collection they must be namespaced so that retrieving specific fields can be \ndone with respect to specific data sources.\n\nHere's an example of defining a data sources object for a remote API:\n\n```javascript\nvar data_sources = new LocusZoom.DataSources();\ndata_sources.add(\"trait\", [\"AssociationLZ\", { url: \"http://server.com/api/\", params: {source: 1} }]);\n```\n\nThe above example adds an \"AssociationLZ\" data source (a predefined data source designed to make requests for \nassociation data) with a defined URL. The namespace for this data source is \"trait\".\n\nData sources can also be local files:\n\n```javascript\ndata_sources = new LocusZoom.DataSources();\ndata_sources.add(\"trait\", [\"AssociationLZ\", { url: \"file:///path/to/data.json\" }]);\n```\n\nRefer to the [Data Sources Documentation](https://github.com/statgen/locuszoom/wiki/Data-Sources) for more information \non using predefined data sources or extending/creating custom data sources.\n\n### 3. Define a Layout\n\n**Layout** is a serializable object that describes the configuration of the LocusZoom plot, including what data will be\n pulled from the data sources and displayed in what way, along with visual characteristics like color and geometry.\n\nA layout definition may look something like this:\n\n```javascript\nvar layout = {\n width: 500,\n height: 500,\n panels: [\n {\n id: \"association\",\n data_layers: [\n {\n id: \"association\",\n type: \"scatter\",\n fields: [\"trait:position\", \"trait:pvalue\"],\n x_axis: { field: \"trait:position\" },\n y_axis: { field: \"trait:pvalue\" }\n }\n ]\n }\n ]\n};\n```\n\nThe above example defines a basic plot that is 500 pixels on a side and has one panel with one scatter plot data layer\n that pulls in position and pvalue from the \"trait\" data source, mapping position to the x axis and pvalue to the y axis.\n\nThe LocusZoom.js library provides several pre-defined layouts for entire plots and subdivisions of plots such as panels,\n data layers, tool tips, etc. Refer to the [Layout Documentation](https://github.com/statgen/locuszoom/wiki/Layout) \n for more information.\n\n### 4. Put it Together with `LocusZoom.populate()`\n\nWith includes included, data sources defined, and a layout defined, `LocusZoom.populate()` will accept a CSS selector \nstring to populate the first matching element with a plot.\n\nA basic example may then look like this:\n\n```html\n\n \n \n \n \n \n \n \n \n\n```\n\n### Other Ways To Make a LocusZoom Plot\n\n#### Use a Predefined Layout\n\nThe core LocusZoom library comes equipped with several predefined layouts, organized by type (\"plot\", \"panel\", \n\"data_layer\", and \"toolbar\"). You can see what layouts are predefined by reading the contents of \n`assets/js/app/Layouts.js` or in the browser by entering `LocusZoom.Layouts.list()` (or to list one specific type: \n`LocusZoom.Layouts.list(type)`).\n\nGet any predefined layout by type and name using `LocusZoom.Layouts.get(type, name)`.\n \n#### Build a Layout Using Some Predefined Pieces\n\n`LocusZoom.Layouts.get(type, name)` can also be used to pull predefined layouts of smaller pieces, like data layers or \ntoolbars, into a custom layout:\n\n```javascript\nvar layout = {\n width: 1000,\n height: 500,\n panels: [\n LocusZoom.Layouts.get(\"panel\",\"gwas\"),\n {\n id: \"custom_panel\",\n ...\n },\n LocusZoom.Layouts.get(\"panel\",\"genes\")\n ]\n ...\n};\n```\n\n#### Modify a Predefined Layout\n\nThe `get()` function also accepts a partial layout to be merged with the predefined layout as a third argument, \nproviding the ability to use predefined layouts as starting points for custom layouts with only minor differences. Example:\n\n```javascript\nvar changes = {\n label_font_size: 20,\n transition: false\n};\nLocusZoom.Layouts.get(\"data_layer\", \"genes\", changes);\n```\n\n#### Predefining State by Building a State Object\n\n**State** is a serializable JSON object that describes orientation to specific data from data sources, and specific \ninteractions with the layout. This can include a specific query against various data sources or pre-selecting specific\n elements. Essentially, the state object is what tracks these types of user input under the hood in LocusZoom, and it \n can be predefined at initialization as a top-level parameter in the layout. For example:\n\n```javascript\nvar layout = LocusZoom.Layouts.get('plot', 'standard_association', { state: { chr: 6, start: 20379709, end: 20979709 } })\n```\n\n#### Predefining State With `data-region`\n\nYou can also describe the locus query aspect of the State (chromosome, start, and end position) using a `data-region`\n attribute of the containing element before populating it, like so:\n\n```html\n\n```\n\nWhen `LocusZoom.populate()` is executed on the element defined above it will automatically parse any `data-region` \nparameter to convert those values into the initial state.\n\n## Development Setup\n\n### Dependencies\n\nLocusZoom is an entirely client-side application designed to plug into arbitrary data sets, be they local files, APIs,\n or something else entirely. It has the following vendor dependencies:\n\n* [d3](http://d3js.org/) for a data visualization framework\n\n### Build System and Automated Testing\n\nLocusZoom is bundled using Webpack. To install all necessary dependencies for a development environment, run:\n\n```\n$ npm install\n```\n\nWe recommend using node.js v12 or greater to build the library and run tests.\n\nOnce complete run `npm run build` from the top of the application directory to run all tests and build the LocusZoom library bundle.\n\nThis build process will also write sourcemaps, to help with debugging code even in production environments.\n\n#### Other supported gulp commands:\n* `npm run test` - Run unit tests (optional: `npm run test:coverage` to output a code coverage report)\n* `npm run dev` - Automatically rebuild the library whenever code changes (development mode)\n* `npm run build` - Run tests, and if they pass, build the library for release\n* `npm run css` - Rebuild the CSS using SASS\n* `npm run docs` - Build the library documentation\n\n\n#### Automated Testing\n\nLocusZoom uses [Mocha](https://mochajs.org/) for unit testing. Tests are located in the `test` subdirectory.\n\n### Linting\nLocusZoom is also linted using \n[ESLint](http://eslint.org/), the rules for which can be found in `.eslintrc`. This will run automatically as part of all new code commits, and during every build. \n\n## Help and Support\n\nFull documentation can be found here: [github.com/statgen/locuszoom/wiki](https://github.com/statgen/locuszoom/wiki)\n\nA LocusZoom discussion forum is available here: [groups.google.com/forum/#!forum/locuszoom](https://groups.google.com/forum/#!forum/locuszoom). \nFor the most effective help, please specify that your question is about \"LocusZoom.js\".\n\nIf you have questions or feedback please file an issue on the [LocusZoom.js GitHub repository](https://github.com/statgen/locuszoom/issues) or post at the discussion forum referenced above.\n","readmeFilename":"README.md","gitHead":"e8f1ca33d6e86ec0b8277a2c9a9af3b624a442b8","bugs":{"url":"https://github.com/statgen/locuszoom/issues"},"_id":"locuszoom@0.13.0-beta.4","_nodeVersion":"12.20.0","_npmVersion":"6.14.8","dist":{"integrity":"sha512-7wgVezQcAbkTLTMGuT1spaLlCvT17Ehptfzh0kWzBeVxHIuBa6q5ZOgyEs/QQSgTuxjCjGB9Xi69z0xbpE4qgQ==","shasum":"ad915c7d4d8240b1add48d41208cef5702a67f80","tarball":"https://registry.npmjs.org/locuszoom/-/locuszoom-0.13.0-beta.4.tgz","fileCount":147,"unpackedSize":4114893,"npm-signature":"-----BEGIN PGP SIGNATURE-----\r\nVersion: OpenPGP.js v3.0.13\r\nComment: https://openpgpjs.org\r\n\r\nwsFcBAEBCAAQBQJgDuknCRA9TVsSAnZWagAAq3sQAInmf+tYoNmcERZBkFtO\n5GZZxlM80oSlquPSBxvyWnIue5kD9KzmG/jsANFcU48aLYqWMf5T89DWV4jo\n9/7+kVp9ZQ/N2Kbw5K40h6Nurm2dQKQqcuzs6eVFsRQAAd652GGwZXkPQJK5\n0HYuH08jMlOh2XOijztK2+RBCry4qVLws9RmudWX8jvm7kO85hq09pkH30Rb\nqAei3u8Jn7B+XAQ507lHzUm4To77vLSfmrXxeQ2Rq91IHpYOdDRGYo4fHu8w\nnKbCux0mTVKuKCwU+mlDsxmsgnTPLw1OO4Etr2ejF9Ia7o4qF9SOW2l6VSey\ndnloWpQXY8IjlQKTG5cFrlAkpe8wbzdh9bUI8LOoFg4v1LK+MbqQvZnpwDnh\nvD1JhwsOoN4Hlj9mmLG3x6O8nl2+UwY6dMx7o3dzfYuafeJi86bj+VcbmnhR\ny2xUqpQtX+gMy43mbxaade/gUWMApiyI7VOAcFK+hbhhlcleWCQOhZUm9VLx\ngjvkofKX+AbwJJo72k2uD0c7pkwbTpKu46wRXjVqoBxxQH3QUSgLHxQ6qCdl\nO05GhIG60eNn3SjBWTHsy0aCm4QgrkXkn9Ap86Gq8+6WGLDQ3w7WvAknpaUu\neyHbkoZPfhc1sgDt294G6GwJ3GSb3vnmOAXyHRwfQGTdIhZqWt7aL8XQK+HN\nazWj\r\n=GeHX\r\n-----END PGP SIGNATURE-----\r\n","signatures":[{"keyid":"SHA256:jl3bwswu80PjjokCgh0o2w5c2U4LhQAE57gj9cz1kzA","sig":"MEQCIEwRD5puUC4MdiqTiajF11tWpgEMXly/Mek7A8L5W9d1AiAMMJwru5fxXMLXYBiJbQ+MZgxS5f4dHzyR6CgR9qorew=="}]},"_npmUser":{"name":"abought","email":"abought@gmail.com"},"directories":{},"maintainers":[{"name":"frencil","email":"frencils@gmail.com"},{"name":"abought","email":"abought@gmail.com"},{"name":"welchr","email":"welchr@umich.edu"}],"_npmOperationalInternal":{"host":"s3://npm-registry-packages","tmp":"tmp/locuszoom_0.13.0-beta.4_1611589926899_0.06119367704809009"},"_hasShrinkwrap":false},"0.13.0":{"name":"locuszoom","version":"0.13.0","main":"dist/locuszoom.app.min.js","module":"esm/index.js","sideEffects":true,"description":"Generate interactive visualizations of statistical genetic data","keywords":["visualization","genetics","genes","gwas","phewas"],"homepage":"http://locuszoom.org","license":"MIT","author":{"name":"University of Michigan Center for Statistical Genetics"},"contributors":[{"name":"Christopher Clark"},{"name":"Matthew Flickinger"},{"name":"Ryan Welch"},{"name":"Peter VandeHaar"},{"name":"Andy Boughton","email":"abought@umich.edu"}],"engines":{"node":">=10.13.0"},"repository":{"type":"git","url":"git+https://github.com/statgen/locuszoom.git"},"scripts":{"echo_version":"echo \"export default '${npm_package_version}';\" > esm/version.js","test":"eslint esm/ test/ && mocha --recursive test","test:coverage":"nyc --reporter=text mocha --recursive test/**/*.js","css":"sass --style compressed ./css/locuszoom.scss ./dist/locuszoom.css","dev":"npm run css && webpack --watch --config webpack.dev.cjs","build":"npm run echo_version && npm run test && npm run css && webpack --config webpack.prod.cjs && npm run docs","docs":"./build_docs.sh"},"dependencies":{"d3":"^5.16.0"},"devDependencies":{"@babel/core":"^7.13.1","@babel/preset-env":"^7.13.5","@babel/register":"^7.13.0","babel-loader":"^8.2.2","babel-plugin-module-resolver":"^4.1.0","chai":"^4.3.0","clean-webpack-plugin":"^3.0.0","eslint":"^7.20.0","eslint-webpack-plugin":"^2.5.2","friendly-errors-webpack-plugin":"^1.7.0","jsdoc":"^3.6.6","jsdom":"^16.4.0","jsdom-global":"^3.0.2","mocha":"^8.3.0","nyc":"^15.1.0","sass":"^1.32.8","sass-loader":"^11.0.1","sinon":"^6.3.5","source-map-loader":"^2.0.1","webpack":"^5.24.2","webpack-cli":"^4.5.0","webpack-merge":"^5.7.3"},"gitHead":"aa3299fba84039075f53f052c8ea04579f0379e6","bugs":{"url":"https://github.com/statgen/locuszoom/issues"},"_id":"locuszoom@0.13.0","_nodeVersion":"12.20.0","_npmVersion":"7.6.0","dist":{"integrity":"sha512-jl6bwhMlj2oVrp+ahVwmBK9qUxtFX3uQwr2htLYQiCz73EOQCDYmRyjF1TG3xMgf05NPh76d1s34bcpQFgvpLw==","shasum":"f1899c3d4ebe666b58b98ce0d396cdc54afc0393","tarball":"https://registry.npmjs.org/locuszoom/-/locuszoom-0.13.0.tgz","fileCount":286,"unpackedSize":8109415,"npm-signature":"-----BEGIN PGP SIGNATURE-----\r\nVersion: OpenPGP.js v3.0.13\r\nComment: https://openpgpjs.org\r\n\r\nwsFcBAEBCAAQBQJgOXw1CRA9TVsSAnZWagAAdHgP/R3FvPrBbUFQf1ivEKWL\njN3Wgbhxgcvnxuq1ZmMVwAtvlu6JytTv+8XK/UT9jJb0Y9gxxfflpOYZgBb1\nZczOrz0YZ8GES6SsF95ZmxRSFDnQLp0CQgqL3nAGj0ABfD3bKSOKkdUm/RGp\nqooSgYfiZlXEe1Eas0hdlvvZFtZ5CQ5TokYuk/bjiogQkfoSOBEZw9ce2Guc\nNutCNBG8I+HfTvBZv33oPkrglaHm5vZyMsYJapY4RomrjxpOg25gFqXViL12\n/sgKDUzmt11fMhwI4973EFAOJFm1aIdiZJGdBWssDvxIv4TH7rGpaq0idQxW\n+vc4RXSja9A2oDMpVOZqqVrlELRaD+8cWfA1fmBiZAkrmVrWvKdB+6YXGaEY\n1Zmq5vIilrjQp8Yafv7lOEjXmU14Ws82QwM5RG55Qrt3Hri7LU1Xp7nJXu6A\n6VjtudmsW3T1ntxiLGz1rETLX/XGWcTyEqK/hJcj/ebG9rwA/kVXL2P6Xgr6\nnSzGPkOu8kJ+2fhYLUgteho7A7L2kzQ1Hfwz9nNENY8kodu0u8SGsT2DhRhj\nxrS5i7rIy+wGgithmPZGIUpzdwVT/MdWDNS+sgBDe5l5PiCY5Biv8KolLjHM\n31leVFacp3CY7qBBcmSjVI4kMhQdocK3DkZoIBpvH0L7lwO4CzdhSM1OvM3d\nH/aK\r\n=noqe\r\n-----END PGP SIGNATURE-----\r\n","signatures":[{"keyid":"SHA256:jl3bwswu80PjjokCgh0o2w5c2U4LhQAE57gj9cz1kzA","sig":"MEYCIQDAgdbszv0FqooyZyQjgdq7sYUuHRbfzJG58RieN/x+RAIhAIPS5ayuNsHBOuTXKfNh8zLjsdrthwpZ5S+Urk6gKD5J"}]},"_npmUser":{"name":"abought","email":"abought@gmail.com"},"directories":{},"maintainers":[{"name":"frencil","email":"frencils@gmail.com"},{"name":"abought","email":"abought@gmail.com"},{"name":"welchr","email":"welchr@umich.edu"}],"_npmOperationalInternal":{"host":"s3://npm-registry-packages","tmp":"tmp/locuszoom_0.13.0_1614380085404_0.15588838908582892"},"_hasShrinkwrap":false},"0.13.1":{"name":"locuszoom","version":"0.13.1","main":"dist/locuszoom.app.min.js","module":"esm/index.js","sideEffects":true,"description":"Generate interactive visualizations of statistical genetic data","keywords":["visualization","genetics","genes","gwas","phewas"],"homepage":"http://locuszoom.org","license":"MIT","author":{"name":"University of Michigan Center for Statistical Genetics"},"contributors":[{"name":"Christopher Clark"},{"name":"Matthew Flickinger"},{"name":"Ryan Welch"},{"name":"Peter VandeHaar"},{"name":"Andy Boughton","email":"abought@umich.edu"}],"engines":{"node":">=10.13.0"},"repository":{"type":"git","url":"git+https://github.com/statgen/locuszoom.git"},"scripts":{"echo_version":"echo \"export default '${npm_package_version}';\" > esm/version.js","test":"eslint esm/ test/ && mocha --recursive test","test:coverage":"nyc --reporter=text mocha --recursive test/**/*.js","css":"sass --style compressed ./css/locuszoom.scss ./dist/locuszoom.css","dev":"npm run css && webpack --watch --config webpack.dev.cjs","build":"npm run echo_version && npm run test && npm run css && webpack --config webpack.prod.cjs && npm run docs","docs":"./build_docs.sh"},"dependencies":{"d3":"^5.16.0"},"devDependencies":{"@babel/core":"^7.13.1","@babel/preset-env":"^7.13.5","@babel/register":"^7.13.0","babel-loader":"^8.2.2","babel-plugin-module-resolver":"^4.1.0","chai":"^4.3.0","clean-webpack-plugin":"^3.0.0","eslint":"^7.20.0","eslint-webpack-plugin":"^2.5.2","friendly-errors-webpack-plugin":"^1.7.0","jsdoc":"^3.6.6","jsdom":"^16.4.0","jsdom-global":"^3.0.2","mocha":"^8.3.0","nyc":"^15.1.0","sass":"^1.32.8","sass-loader":"^11.0.1","sinon":"^6.3.5","source-map-loader":"^2.0.1","webpack":"^5.24.2","webpack-cli":"^4.5.0","webpack-merge":"^5.7.3"},"gitHead":"efaad239754a7dd7e8ec9c593e5fc9e404d14190","bugs":{"url":"https://github.com/statgen/locuszoom/issues"},"_id":"locuszoom@0.13.1","_nodeVersion":"12.20.0","_npmVersion":"7.6.0","dist":{"integrity":"sha512-zorxHljraidDa8US+hSuma/CUAm29Hdb3C7VdyoCXWhcPLu6IWfbPKW+h8dqVcY3xvn3+oRl8IRy1WMJmQUh2A==","shasum":"8f207f4db3bb579525d081a0c33c86f583a1382e","tarball":"https://registry.npmjs.org/locuszoom/-/locuszoom-0.13.1.tgz","fileCount":286,"unpackedSize":8109651,"npm-signature":"-----BEGIN PGP SIGNATURE-----\r\nVersion: OpenPGP.js v3.0.13\r\nComment: https://openpgpjs.org\r\n\r\nwsFcBAEBCAAQBQJgQotbCRA9TVsSAnZWagAALj4P/iYNuA4yRyOWgPUtENEf\nx0K1pOFqatwQj2IIHMgNadrl0NutTtNeHB08mxEOo0m5fUzZQxfXlzvRBcf3\nduuw27ma/i6YGwHaSZqpvuEQmsoMIviMHwWGPcrzuVj/RhMbJeOpvo2p0oIj\nhzkM8D4tpgf54/I5uac8UwdyMT1qs2nFMbyhH4RLgpldwr5iYtt4TZeSzXoX\nFVqzzUh27gROqoWuSMBl33/slugyFJPO5P5P7e98nppwQXWPHG0FE7SXzTTq\n5pMfby/ZUsLU3USP3+cRxyBlCryUzm8k3Gjn7pZ/SzP1QBIIZ6Wdueww6fW8\nl+3Y6Xf2Bg49wyJVayjKENHDkzoH2yEMrdKaEa8oc5HKolXNAwKULH+bha5M\n9eoxK+u62KvhE92WQQztUZQra9tjjdkQwf7hNY3K5pT0181P7hVOYgiR9RDq\ntLnQuMzI7IzGCe5G1oHgKW8Ui7j28K9iPAix6Hu/oLygVvh2KZh2Njxbm/uC\nGfk7BPYenZTXjuteP9sZSrKp+VBxY0ikBM2OFijpw1FyDOBDJCqbuvGFE69O\nH6CMZUYIoYNYjTNplPxV20s7eyU6xy5m7z0/ltj1+NcYPJmYp2eVvfatP+ua\nAWDkejglG5Js9XVHMziysqvZTrTvbxjKZA7prSkKime29bpJ5n2SRDL3fEMa\n2C9r\r\n=Llcy\r\n-----END PGP SIGNATURE-----\r\n","signatures":[{"keyid":"SHA256:jl3bwswu80PjjokCgh0o2w5c2U4LhQAE57gj9cz1kzA","sig":"MEQCIBFUWOBweSwkyoSomNeOHzy9H/8A+jJnASb4jLDcVRctAiANJIW0wuHlCPLJ7OYLBeJR4eAwIyZSpgia+tVrhrvtug=="}]},"_npmUser":{"name":"abought","email":"abought@gmail.com"},"directories":{},"maintainers":[{"name":"frencil","email":"frencils@gmail.com"},{"name":"abought","email":"abought@gmail.com"},{"name":"welchr","email":"welchr@umich.edu"}],"_npmOperationalInternal":{"host":"s3://npm-registry-packages","tmp":"tmp/locuszoom_0.13.1_1614973786733_0.914011018335144"},"_hasShrinkwrap":false},"0.13.2":{"name":"locuszoom","version":"0.13.2","main":"dist/locuszoom.app.min.js","module":"esm/index.js","sideEffects":true,"description":"Generate interactive visualizations of statistical genetic data","keywords":["visualization","genetics","genes","gwas","phewas"],"homepage":"http://locuszoom.org","license":"MIT","author":{"name":"University of Michigan Center for Statistical Genetics"},"contributors":[{"name":"Christopher Clark"},{"name":"Matthew Flickinger"},{"name":"Ryan Welch"},{"name":"Peter VandeHaar"},{"name":"Andy Boughton","email":"abought@umich.edu"}],"engines":{"node":">=10.13.0"},"repository":{"type":"git","url":"git+https://github.com/statgen/locuszoom.git"},"scripts":{"echo_version":"echo \"export default '${npm_package_version}';\" > esm/version.js","test":"eslint esm/ test/ && mocha --recursive test","test:coverage":"nyc --reporter=text mocha --recursive test/**/*.js","css":"sass --style compressed ./css/locuszoom.scss ./dist/locuszoom.css","dev":"npm run css && webpack --watch --config webpack.dev.cjs","build":"npm run echo_version && npm run test && npm run css && webpack --config webpack.prod.cjs && npm run docs","docs":"./build_docs.sh"},"dependencies":{"d3":"^5.16.0"},"devDependencies":{"@babel/core":"^7.13.1","@babel/preset-env":"^7.13.5","@babel/register":"^7.13.0","babel-loader":"^8.2.2","babel-plugin-module-resolver":"^4.1.0","chai":"^4.3.0","clean-webpack-plugin":"^3.0.0","eslint":"^7.20.0","eslint-webpack-plugin":"^2.5.2","friendly-errors-webpack-plugin":"^1.7.0","jsdoc":"^3.6.6","jsdom":"^16.4.0","jsdom-global":"^3.0.2","mocha":"^8.3.0","nyc":"^15.1.0","sass":"^1.32.8","sass-loader":"^11.0.1","sinon":"^6.3.5","source-map-loader":"^2.0.1","webpack":"^5.24.2","webpack-cli":"^4.5.0","webpack-merge":"^5.7.3"},"gitHead":"f5afb00aa0a594b467ff858f265afcc33cb06e6a","bugs":{"url":"https://github.com/statgen/locuszoom/issues"},"_id":"locuszoom@0.13.2","_nodeVersion":"12.20.0","_npmVersion":"7.6.0","dist":{"integrity":"sha512-CshSuHD+Qs7ue3ts2Itv52iYw7yo5AhYBfBD1mJRy+okPlEczjyOEZqgytJqNG3mVTCmcuoo96YyzspePDIvNA==","shasum":"544a0434b44d1e3e7155aaa34395fb90cf783ed6","tarball":"https://registry.npmjs.org/locuszoom/-/locuszoom-0.13.2.tgz","fileCount":287,"unpackedSize":8137334,"npm-signature":"-----BEGIN PGP SIGNATURE-----\r\nVersion: OpenPGP.js v3.0.13\r\nComment: https://openpgpjs.org\r\n\r\nwsFcBAEBCAAQBQJgdGWzCRA9TVsSAnZWagAAfrsP/0YKdKA8L06IuhPGKlDr\nHORtiYRhsayh1UctawFNRqDMjFH0DlYyKXKG19FpUU+rpBRkAvSna+wKaEwZ\npQ4pSmxyWuq1p2c2SCDGKX+pHLnBKXPygV//Hs7Fx6klUy+M0YGW6dODA4E5\nD/UgAa2lzNpBTk7q2x3EhtRyzEzW7LPemJ2C7rwaDEFHRXwIC0AcGEAnqume\ncUlSmklFpc/0NK2xRhf7o92oqtpVc5j2d89ZfPf7oJZd540OgYoAeV5XQYGL\n/TsLAfM/t3vSuvOmn8C4uJ8pNzGym/7lYMDDz/lOuVfjtGiMpeyoyPWnQDr9\nGlHwCPBD7OwIBG7zI4AlHuI5RrVz3qj7/wtAfAREQRttgDhSMFeZEXFKlCkl\n+sFTWuukIywvAno/9/5xfRfWPW2jkr8EIoB0RGbhORGXxJAxQfyY14CrEVsm\n6FQsQFuXWKXSOsW//DGBXLLf0Gik5/rmoV/JLtK6z6Q1735QvMTx/2HVnXTs\nEQyylFJzDSUfQAttIQ+rGt1r0q/O65B7htphWxy9Nkhw4cH1d7K5aqutHLFM\naT+XmR+43bJkoOrsC8ak0TgJ98NSUcw+br5jGMUMB5WS2k3cHdheADhkmOTm\nQiPNKcdpcGjy/fqcHV+xczfUGi8DKQgPEZLlF5XGLqoveswAHlv0HCxSwla5\nOC4H\r\n=ia24\r\n-----END PGP SIGNATURE-----\r\n","signatures":[{"keyid":"SHA256:jl3bwswu80PjjokCgh0o2w5c2U4LhQAE57gj9cz1kzA","sig":"MEUCIQDcwhAkUVvAFLgJWSS7njy3RTvyuRcQ8LLpXLSp++E4NAIgP9qwzAZrRYRc6q8GUlOwmTUNVnAgkQJzUj1LmYMqLM0="}]},"_npmUser":{"name":"abought","email":"abought@gmail.com"},"directories":{},"maintainers":[{"name":"frencil","email":"frencils@gmail.com"},{"name":"abought","email":"abought@gmail.com"},{"name":"welchr","email":"welchr@umich.edu"}],"_npmOperationalInternal":{"host":"s3://npm-registry-packages","tmp":"tmp/locuszoom_0.13.2_1618240946754_0.7837154525113923"},"_hasShrinkwrap":false},"0.13.3":{"name":"locuszoom","version":"0.13.3","main":"dist/locuszoom.app.min.js","module":"esm/index.js","sideEffects":true,"description":"Generate interactive visualizations of statistical genetic data","keywords":["visualization","genetics","genes","gwas","phewas"],"homepage":"http://locuszoom.org","license":"MIT","author":{"name":"University of Michigan Center for Statistical Genetics"},"contributors":[{"name":"Christopher Clark"},{"name":"Matthew Flickinger"},{"name":"Ryan Welch"},{"name":"Peter VandeHaar"},{"name":"Andy Boughton","email":"abought@umich.edu"}],"engines":{"node":">=10.13.0"},"repository":{"type":"git","url":"git+https://github.com/statgen/locuszoom.git"},"scripts":{"echo_version":"echo \"export default '${npm_package_version}';\" > esm/version.js","test":"eslint esm/ test/ && mocha --recursive test","test:coverage":"nyc --reporter=text mocha --recursive test/**/*.js","css":"sass --style compressed ./css/locuszoom.scss ./dist/locuszoom.css","dev":"npm run css && webpack --watch --config webpack.dev.cjs","build":"npm run echo_version && npm run test && npm run css && webpack --config webpack.prod.cjs && npm run docs","docs":"./build_docs.sh"},"dependencies":{"d3":"^5.16.0"},"devDependencies":{"@babel/core":"^7.13.1","@babel/preset-env":"^7.13.5","@babel/register":"^7.13.0","babel-loader":"^8.2.2","babel-plugin-module-resolver":"^4.1.0","chai":"^4.3.0","clean-webpack-plugin":"^3.0.0","eslint":"^7.20.0","eslint-webpack-plugin":"^2.5.2","friendly-errors-webpack-plugin":"^1.7.0","jsdoc":"^3.6.6","jsdom":"^16.4.0","jsdom-global":"^3.0.2","mocha":"^8.3.0","nyc":"^15.1.0","sass":"^1.32.8","sass-loader":"^11.0.1","sinon":"^6.3.5","source-map-loader":"^2.0.1","webpack":"^5.24.2","webpack-cli":"^4.5.0","webpack-merge":"^5.7.3"},"gitHead":"e1295004c41e61bf5ff5693a3b7ff8550204c53b","bugs":{"url":"https://github.com/statgen/locuszoom/issues"},"_id":"locuszoom@0.13.3","_nodeVersion":"12.22.1","_npmVersion":"6.14.12","dist":{"integrity":"sha512-kZ7BCdWqO7TkyBSKu/d34BgCKVC0MF3NSerHmM6jEgCvJJfoP16OYyoN81/mBuhHodU16zkw1Qnp69csyCyONA==","shasum":"36263b804eb5c12ecb0a10c65afab796dbd28bfe","tarball":"https://registry.npmjs.org/locuszoom/-/locuszoom-0.13.3.tgz","fileCount":290,"unpackedSize":8210537,"npm-signature":"-----BEGIN PGP SIGNATURE-----\r\nVersion: OpenPGP.js v3.0.13\r\nComment: https://openpgpjs.org\r\n\r\nwsFcBAEBCAAQBQJgqAURCRA9TVsSAnZWagAA1DAP/19suPI6ibZLPlCS0Yue\n9dYyPewIHzsuMo9F0QLi1DxB4fjh0pcGKAyPmpV2hOZLhqwNne9FwfXCqjI8\nCSN4BXWpkr34E4igrJabKHbVXQu911pBUvqmt8NECZwH6zQD2oQ0ir7II6Na\n9RXdXVH/l9mKuuHjRgJbU/33TKRxK/D7d/9ydubPupNh7j2nI7H0reQexRgK\nwyfHDNgYS9m26Yg6AQX47otgWlZJzQIznHE87V3BoCG4topFHV0CKiVg2JEA\ngb370xUaYfDyM/vg5qvcjxIqCvfaEIJzTCakHnBoUVdabAR63BLHLX6Vzh4R\n1fpZTibla9rSyaU7+yA3sMCAswkMyEQkwxAsiGBXkoHE6jfpL7zhFAxHOkDn\nJrcvTyxEqHglbq14tG6lbEXQngt/ORTEBf7dK0sUtoUESaOPgdbod/OMl8LQ\nL/TuabP2/pbYmCr0t5FT2lxegNczPBgFQwIPFdYtnJXrubdff2/Fhbajxf97\nLQu94Vqzaw3FpBPTC5152b23KfsB9jVR5iPr9nIga/uYYKogGhnvNUK2tQFR\nbN8Nz6sriJVbVqGswv1u/jKZRGZDknS33XJjgN6quEAMRvKXXWbjxIFje5j4\ncmgln5WaElrb/vMq1esgba9UiMewXAMpkoQwMewQOsIYakdvllaa4/3tjlEz\nh36I\r\n=mHvy\r\n-----END PGP SIGNATURE-----\r\n","signatures":[{"keyid":"SHA256:jl3bwswu80PjjokCgh0o2w5c2U4LhQAE57gj9cz1kzA","sig":"MEUCIQDwZTf1N1tTKCmUspbfWdNdw6pIzyOJ9coQEhuGwXKRUAIgG+Gu1YPzQ+Yw15xkp3Imus5PIbmUQ2bwargIabsl/f0="}]},"_npmUser":{"name":"abought","email":"abought@gmail.com"},"directories":{},"maintainers":[{"name":"frencil","email":"frencils@gmail.com"},{"name":"abought","email":"abought@gmail.com"},{"name":"welchr","email":"welchr@umich.edu"}],"_npmOperationalInternal":{"host":"s3://npm-registry-packages","tmp":"tmp/locuszoom_0.13.3_1621624080890_0.4767847095188491"},"_hasShrinkwrap":false},"0.13.4":{"name":"locuszoom","version":"0.13.4","main":"dist/locuszoom.app.min.js","module":"esm/index.js","sideEffects":true,"description":"Generate interactive visualizations of statistical genetic data","keywords":["visualization","genetics","genes","gwas","phewas"],"homepage":"https://github.com/statgen/locuszoom","license":"MIT","author":{"name":"University of Michigan Center for Statistical Genetics"},"contributors":[{"name":"Christopher Clark"},{"name":"Matthew Flickinger"},{"name":"Ryan Welch"},{"name":"Peter VandeHaar"},{"name":"Andy Boughton","email":"abought@umich.edu"}],"engines":{"node":">=10.13.0"},"repository":{"type":"git","url":"git+https://github.com/statgen/locuszoom.git"},"scripts":{"echo_version":"echo \"export default '${npm_package_version}';\" > esm/version.js","test":"eslint esm/ test/ && mocha --recursive test","test:coverage":"nyc --reporter=text mocha --recursive test/**/*.js","css":"sass --style compressed ./css/locuszoom.scss ./dist/locuszoom.css","dev":"npm run css && webpack --watch --config webpack.dev.cjs","build":"npm run echo_version && npm run test && npm run css && webpack --config webpack.prod.cjs && npm run docs","docs":"./build_docs.sh"},"dependencies":{"d3":"^5.16.0"},"devDependencies":{"@babel/core":"^7.13.1","@babel/preset-env":"^7.13.5","@babel/register":"^7.13.0","babel-loader":"^8.2.2","babel-plugin-module-resolver":"^4.1.0","chai":"^4.3.0","clean-webpack-plugin":"^3.0.0","eslint":"^7.20.0","eslint-webpack-plugin":"^2.5.2","friendly-errors-webpack-plugin":"^1.7.0","jsdoc":"^3.6.7","jsdom":"^16.4.0","jsdom-global":"^3.0.2","mocha":"^8.3.0","nyc":"^15.1.0","sass":"^1.32.8","sass-loader":"^11.0.1","sinon":"^6.3.5","source-map-loader":"^2.0.1","webpack":"^5.24.2","webpack-cli":"^4.5.0","webpack-merge":"^5.7.3"},"gitHead":"03fc214b9538656e06198f3706413f5c87c00911","bugs":{"url":"https://github.com/statgen/locuszoom/issues"},"_id":"locuszoom@0.13.4","_nodeVersion":"12.22.1","_npmVersion":"6.14.12","dist":{"integrity":"sha512-CV8Nl1EyVONNrDuKrURrGPH1DPKZcFq3NaL51mHNTZpaf8K7wXgLiqEKKth0nn+arrTLbOjMP7ntd1Bg8wf/Wg==","shasum":"808c62228fb2537cdf20bfc05f4bb198f87d90c5","tarball":"https://registry.npmjs.org/locuszoom/-/locuszoom-0.13.4.tgz","fileCount":291,"unpackedSize":8212914,"signatures":[{"keyid":"SHA256:jl3bwswu80PjjokCgh0o2w5c2U4LhQAE57gj9cz1kzA","sig":"MEUCIQDqRhoDbG3IET/PCRKdbJG8GaEffVXXiaM34mJi0EsPSwIgFbKdLgUXmlri/gQlSWXrCT9mifm79LFe96mSNiyntDg="}]},"_npmUser":{"name":"abought","email":"abought@gmail.com"},"directories":{},"maintainers":[{"name":"frencil","email":"frencils@gmail.com"},{"name":"abought","email":"abought@gmail.com"},{"name":"welchr","email":"welchr@umich.edu"}],"_npmOperationalInternal":{"host":"s3://npm-registry-packages","tmp":"tmp/locuszoom_0.13.4_1632250324183_0.9898556560026393"},"_hasShrinkwrap":false},"0.14.0-beta.1":{"name":"locuszoom","version":"0.14.0-beta.1","main":"dist/locuszoom.app.min.js","module":"esm/index.js","sideEffects":true,"description":"Generate interactive visualizations of statistical genetic data","keywords":["visualization","genetics","genes","gwas","phewas"],"homepage":"https://github.com/statgen/locuszoom","license":"MIT","author":{"name":"University of Michigan Center for Statistical Genetics"},"contributors":[{"name":"Christopher Clark"},{"name":"Matthew Flickinger"},{"name":"Ryan Welch"},{"name":"Peter VandeHaar"},{"name":"Andy Boughton","email":"abought@umich.edu"}],"engines":{"node":">=10.13.0"},"repository":{"type":"git","url":"git+https://github.com/statgen/locuszoom.git"},"scripts":{"echo_version":"echo \"export default '${npm_package_version}';\" > esm/version.js","test":"eslint esm/ test/ && mocha --recursive test","test:coverage":"nyc --reporter=text mocha --recursive test/**/*.js","css":"sass --style compressed ./css/locuszoom.scss ./dist/locuszoom.css","dev":"npm run css && webpack --watch --config webpack.dev.cjs","build":"npm run echo_version && npm run test && npm run css && webpack --config webpack.prod.cjs && npm run docs","docs":"./build_docs.sh"},"dependencies":{"d3":"^5.16.0","gwas-credible-sets":"^0.1.0","just-clone":"^3.2.1","tabix-reader":"^1.0.1","undercomplicate":"^0.1.1"},"devDependencies":{"@babel/core":"^7.13.1","@babel/preset-env":"^7.13.5","@babel/register":"^7.13.0","babel-loader":"^8.2.2","babel-plugin-module-resolver":"^4.1.0","chai":"^4.3.0","clean-webpack-plugin":"^3.0.0","eslint":"^7.20.0","eslint-webpack-plugin":"^2.5.2","friendly-errors-webpack-plugin":"^1.7.0","jsdoc":"^3.6.7","jsdom":"^16.4.0","jsdom-global":"^3.0.2","mocha":"^8.3.0","nyc":"^15.1.0","sass":"^1.32.8","sass-loader":"^11.0.1","sinon":"^6.3.5","source-map-loader":"^2.0.1","webpack":"^5.24.2","webpack-cli":"^4.5.0","webpack-merge":"^5.7.3"},"gitHead":"f96368110b88b952ab3de41a833fbbda09069e45","readme":"# LocusZoom\n\nLocusZoom is a Javascript/d3 embeddable plugin for interactively visualizing statistical genetic data from customizable sources.\n\n**This is a low level library aimed at developers who want to customize their own data sharing/visualization. If you are a genetics researcher who just wants to make a fast visualization of your research results, try our user-friendly plot-your-own data services built on LocusZoom.js: [my.locuszoom.org](https://my.locuszoom.org/) and [LocalZoom](https://statgen.github.io/localzoom/)**.\n\n\n\n\nSee [https://statgen.github.io/locuszoom/docs/](https://statgen.github.io/locuszoom/docs/) for full documentation and API reference.\n\nTo see functional examples of plots generated with LocusZoom.js see [statgen.github.io/locuszoom](http://statgen.github.io/locuszoom/) and [statgen.github.io/locuszoom/#examples](http://statgen.github.io/locuszoom/#examples).\n\n\n\n## Making a LocusZoom Plot\n\n### 1. Include Necessary JavaScript and CSS\n\nThe page you build that embeds the LocusZoom plugin must include the following resources, found in the `dist` directory:\n\n* `d3.js` \n [D3.js](https://d3js.org/) v5.16.0 is used to draw graphics in LocusZoom plots. It may be loaded [via a CDN](https://cdn.jsdelivr.net/npm/d3@^5.16.0). It must be present before LocusZoom is loaded.\n\n* `locuszoom.app.min.js` \n This is the primary application logic. It should only be included *after* the vendor dependencies have been included. \n\n* `locuszoom.css` \n This is the primary stylesheet. It is namespaced so as not to conflict with any other styles defined on the same page.\n\nInstead of copying the files to your project, **we recommend using CDN links are for these resources** (see [statgen.github.io/locuszoom/](http://statgen.github.io/locuszoom/)).\n\n*The above instructions describe using LocusZoom with pure JS and HTML. If you are using a module build system, LocusZoom supports usage via ES6 imports, eg:* \n\n```javascript\nimport LocusZoom from 'locuszoom';\nimport 'locuszoom/dist/locuszoom.css';\n```\n\n### 2. Define Data Sources\n\n**Data Sources** is an object representing a collection of arbitrarily many sources from which data for the plot can be requested. When adding sources to the collection they must be namespaced so that retrieving specific fields can be done with respect to specific data sources.\n\nHere's an example of defining a data sources object for a remote API:\n\n```javascript\nvar data_sources = new LocusZoom.DataSources();\ndata_sources.add(\"assoc\", [\"AssociationLZ\", { url: \"http://server.com/api/\", source: 1 }]);\n```\n\nThe above example adds an \"AssociationLZ\" data source (a predefined data source designed to make requests for association data) with a defined URL. The namespace for this data source is \"assoc\".\n\nData sources can also be local files:\n\n```javascript\ndata_sources = new LocusZoom.DataSources();\ndata_sources.add(\"assoc\", [\"AssociationLZ\", { url: \"file:///path/to/data.json\" }]);\n```\n\nRefer to the [Working with data guide](https://statgen.github.io/locuszoom/docs/guides/data_retrieval.html) for more information on using predefined data sources or extending/creating custom data sources.\n\n### 3. Define a Layout\n\n**Layout** is a serializable object that describes the configuration of the LocusZoom plot, including what data will be pulled from the data sources and displayed in what way, along with visual characteristics like color and geometry.\n\nA layout definition may look something like this (simplified example; consult docs for details):\n\n```javascript\nvar layout = {\n width: 500,\n height: 500,\n panels: [\n {\n id: \"association\",\n data_layers: [\n {\n id: \"association\",\n type: \"scatter\",\n x_axis: { field: \"assoc:position\" },\n y_axis: { field: \"assoc:pvalue\" }\n }\n ]\n }\n ]\n};\n```\n\nThe above example defines a basic plot that is 500 pixels on a side and has one panel with one scatter plot data layer that pulls in position and pvalue from the \"trait\" data source, mapping position to the x axis and pvalue to the y axis.\n\nThe LocusZoom.js library provides several pre-defined layouts for entire plots and subdivisions of plots such as panels, data layers, tool tips, etc. Refer to the [Layouts and visualization options guide](https://statgen.github.io/locuszoom/guides/rendering_layouts.html) for more information.\n\n### 4. Put it Together with `LocusZoom.populate()`\n\nWith includes included, data sources defined, and a layout defined, `LocusZoom.populate()` will accept a CSS selector string to populate the first matching element with a plot.\n\nA basic example may then look like this:\n\n```html\n\n \n \n \n \n \n \n \n \n\n```\n\n### Other Ways To Make a LocusZoom Plot\n\n#### Use a Predefined Layout\n\nThe core LocusZoom library comes equipped with several predefined layouts, organized by type (\"plot\", \"panel\", \"data_layer\", and \"toolbar\"). You can see what layouts are predefined by reading the contents of `assets/js/app/Layouts.js` or in the browser by entering `LocusZoom.Layouts.list()` (or to list one specific type: `LocusZoom.Layouts.list(type)`).\n\nGet any predefined layout by type and name using `LocusZoom.Layouts.get(type, name)`.\n\nIf your data matches the field names and formats of the [UMich PortalDev API](https://portaldev.sph.umich.edu/docs/api/v1/#overview-of-api-endpoints), these layouts will provide a quick way to get started. If your data obeys different format rules, customization may be necessary.\n \nSee the [guide to working with layouts](https://statgen.github.io/locuszoom/docs/guides/rendering_layouts.html) for further details.\n\n#### Build a Layout Using Some Predefined Pieces\n\n`LocusZoom.Layouts.get(type, name)` can also be used to pull predefined layouts of smaller pieces, like data layers or \ntoolbars, into a custom layout:\n\n```javascript\nconst layout = {\n width: 1000,\n height: 500,\n panels: [\n LocusZoom.Layouts.get(\"panel\", \"association\"),\n {\n id: \"custom_panel\",\n ...options\n },\n LocusZoom.Layouts.get(\"panel\", \"genes\")\n ],\n ...\n};\n```\n\n#### Modify a Predefined Layout\n\nThe `get()` function also accepts a partial layout to be merged with the predefined layout as a third argument, providing the ability to use predefined layouts as starting points for custom layouts with only minor differences. Example:\n\n```javascript\nconst changes = { label_font_size: 20 };\nLocusZoom.Layouts.get(\"data_layer\", \"genes\", changes);\n```\n\n#### Predefining State by Building a State Object\n\n**State** is a serializable JSON object that describes orientation to specific data from data sources, and specific interactions with the layout. This can include a specific query against various data sources or pre-selecting specific elements. Essentially, the state object is what tracks these types of user input under the hood in LocusZoom, and it can be predefined at initialization as a top-level parameter in the layout. For example:\n\n```javascript\nconst layout = LocusZoom.Layouts.get('plot', 'standard_association', { state: { chr: 6, start: 20379709, end: 20979709 } })\n```\n\n#### Predefining State With `data-region`\n\nYou can also describe the locus query aspect of the State (chromosome, start, and end position) using a `data-region` attribute of the containing element before populating it, like so:\n\n```html\n\n```\n\nWhen `LocusZoom.populate()` is executed on the element defined above it will automatically parse any `data-region` parameter to convert those values into the initial state.\n\n## Development Setup\n\n### Dependencies\n\nLocusZoom is an entirely client-side library designed to plug into arbitrary data sets, be they local files, APIs, or something else entirely. It has the following external dependencies:\n\n* [d3](http://d3js.org/) for data visualization\n\n### Build System and Automated Testing\n\nLocusZoom is bundled using Webpack. To install all necessary dependencies for a development environment, run:\n\n```bash\n$ npm install\n```\n\nWe recommend using node.js v12 or greater to build the library and run tests.\n\nOnce complete run `npm run build` from the top of the application directory to run all tests and build the LocusZoom library bundle.\n\nThis build process will also write sourcemaps, to help with debugging code even in production environments.\n\n#### Other supported build commands:\n\n* `npm run test` - Run unit tests (optional: `npm run test:coverage` to output a code coverage report)\n* `npm run dev` - Automatically rebuild the library whenever code changes (development mode)\n* `npm run build` - Run tests, and if they pass, build the library for release\n* `npm run css` - Rebuild the CSS using SASS\n* `npm run docs` - Build the library documentation\n\n\n#### Automated Testing\n\nLocusZoom uses [Mocha](https://mochajs.org/) for unit testing. Tests are located in the `test` subdirectory. Use `npm run test`.\n\n### Static analysis and code style\nLocusZoom runs code quality checks via [ESLint](http://eslint.org/), the rules for which can be found in `.eslintrc`. This will run automatically as part of all new code commits, and during every build. \n\n## Help and Support\n\nFull documentation can be found here: [docs/](https://statgen.github.io/locuszoom/docs/)\n\nA LocusZoom discussion forum is available here: [groups.google.com/forum/#!forum/locuszoom](https://groups.google.com/forum/#!forum/locuszoom). \nFor the most effective help, please specify that your question is about \"LocusZoom.js\".\n\nIf you have questions or feedback please file an issue on the [LocusZoom.js GitHub repository](https://github.com/statgen/locuszoom/issues) or post at the discussion forum referenced above.\n","readmeFilename":"README.md","bugs":{"url":"https://github.com/statgen/locuszoom/issues"},"_id":"locuszoom@0.14.0-beta.1","_nodeVersion":"12.22.1","_npmVersion":"6.14.12","dist":{"integrity":"sha512-tsCVFWDAVeGlWv20ISS6fkw8kxzsC9hNOC1r/G7C6aV+AOM3FmMx+AfkUB/fYE9KqRLx+Q7zKhSuImZtYFL9kw==","shasum":"a216920ec4b28262c780f5781f1d19dcea4cf609","tarball":"https://registry.npmjs.org/locuszoom/-/locuszoom-0.14.0-beta.1.tgz","fileCount":322,"unpackedSize":8759102,"signatures":[{"keyid":"SHA256:jl3bwswu80PjjokCgh0o2w5c2U4LhQAE57gj9cz1kzA","sig":"MEQCIFVlkNg29PaHeOAoghZfCCUedXymDUKylGdVb3NMCz90AiBquaLj7Tq6S+YmSZJmKwJxdr0Iha58GZid/UYD9W0RaA=="}]},"_npmUser":{"name":"abought","email":"abought@gmail.com"},"directories":{},"maintainers":[{"name":"frencil","email":"frencils@gmail.com"},{"name":"abought","email":"abought@gmail.com"},{"name":"welchr","email":"welchr@umich.edu"}],"_npmOperationalInternal":{"host":"s3://npm-registry-packages","tmp":"tmp/locuszoom_0.14.0-beta.1_1636654606231_0.4090785260130727"},"_hasShrinkwrap":false},"0.14.0-beta.2":{"name":"locuszoom","version":"0.14.0-beta.2","main":"dist/locuszoom.app.min.js","module":"esm/index.js","sideEffects":true,"description":"Generate interactive visualizations of statistical genetic data","keywords":["visualization","genetics","genes","gwas","phewas"],"homepage":"https://github.com/statgen/locuszoom","license":"MIT","author":{"name":"University of Michigan Center for Statistical Genetics"},"contributors":[{"name":"Christopher Clark"},{"name":"Matthew Flickinger"},{"name":"Ryan Welch"},{"name":"Peter VandeHaar"},{"name":"Andy Boughton","email":"abought@umich.edu"}],"engines":{"node":">=10.13.0"},"repository":{"type":"git","url":"git+https://github.com/statgen/locuszoom.git"},"scripts":{"echo_version":"echo \"export default '${npm_package_version}';\" > esm/version.js","test":"eslint esm/ test/ && mocha --recursive test","test:coverage":"nyc --reporter=text mocha --recursive test/**/*.js","css":"sass --style compressed ./css/locuszoom.scss ./dist/locuszoom.css","dev":"npm run css && webpack --watch --config webpack.dev.cjs","build":"npm run echo_version && npm run test && npm run css && webpack --config webpack.prod.cjs && npm run docs","docs":"./build_docs.sh"},"dependencies":{"d3":"^5.16.0","gwas-credible-sets":"^0.1.0","just-clone":"^3.2.1","tabix-reader":"^1.0.1","undercomplicate":"^0.1.1"},"devDependencies":{"@babel/core":"^7.13.1","@babel/preset-env":"^7.13.5","@babel/register":"^7.13.0","babel-loader":"^8.2.2","babel-plugin-module-resolver":"^4.1.0","chai":"^4.3.0","clean-webpack-plugin":"^3.0.0","eslint":"^7.20.0","eslint-webpack-plugin":"^2.5.2","friendly-errors-webpack-plugin":"^1.7.0","jsdoc":"^3.6.7","jsdom":"^16.4.0","jsdom-global":"^3.0.2","mocha":"^8.3.0","nyc":"^15.1.0","sass":"^1.32.8","sass-loader":"^11.0.1","sinon":"^6.3.5","source-map-loader":"^2.0.1","webpack":"^5.24.2","webpack-cli":"^4.5.0","webpack-merge":"^5.7.3"},"readme":"# LocusZoom\n\nLocusZoom is a Javascript/d3 embeddable plugin for interactively visualizing statistical genetic data from customizable sources.\n\n**This is a low level library aimed at developers who want to customize their own data sharing/visualization tools. If you are a genetics researcher who just wants to make a fast visualization of your research results, try our user-friendly plot-your-own data services built on LocusZoom.js: [my.locuszoom.org](https://my.locuszoom.org/) and [LocalZoom](https://statgen.github.io/localzoom/)**.\n\n\n\n\nSee [https://statgen.github.io/locuszoom/docs/](https://statgen.github.io/locuszoom/docs/) for full documentation and API reference.\n\nTo see functional examples of plots generated with LocusZoom.js see [statgen.github.io/locuszoom](http://statgen.github.io/locuszoom/) and [statgen.github.io/locuszoom/#examples](http://statgen.github.io/locuszoom/#examples).\n\n\n\n## Making a LocusZoom Plot\n\n### 1. Include Necessary JavaScript and CSS\n\nThe page you build that embeds the LocusZoom plugin must include the following resources, found in the `dist` directory (or via CDN):\n\n* `d3.js` \n [D3.js](https://d3js.org/) v5.16.0 is used to draw graphics in LocusZoom plots. It may be loaded [via a CDN](https://cdn.jsdelivr.net/npm/d3@^5.16.0). It must be present before LocusZoom is loaded.\n\n* `locuszoom.app.min.js` \n This is the primary application logic. It should only be included *after* the vendor dependencies have been included. \n\n* `locuszoom.css` \n This is the primary stylesheet. It is namespaced so as not to conflict with any other styles defined on the same page.\n\nInstead of copying the files to your project, **we recommend using CDN links are for these resources** (see [statgen.github.io/locuszoom/](http://statgen.github.io/locuszoom/)).\n\n*The above instructions describe using LocusZoom with pure JS and HTML. If you are using a module build system, LocusZoom supports usage via ES6 imports, eg:* \n\n```javascript\nimport LocusZoom from 'locuszoom';\nimport 'locuszoom/dist/locuszoom.css';\n```\n\n### 2. Define Data Sources\n\n**Data Sources** is an object representing a collection of arbitrarily many sources from which data for the plot can be requested. When adding sources to the collection they must be namespaced so that retrieving specific fields can be done with respect to specific data sources.\n\nHere's an example of defining a data sources object for a remote API:\n\n```javascript\nvar data_sources = new LocusZoom.DataSources();\ndata_sources.add(\"assoc\", [\"AssociationLZ\", { url: \"http://server.com/api/\", source: 1 }]);\n```\n\nThe above example adds an \"AssociationLZ\" data source (a predefined data source designed to make requests for association data) with a defined URL. The namespace for this data source is \"assoc\".\n\nData sources can also be local files:\n\n```javascript\ndata_sources = new LocusZoom.DataSources();\ndata_sources.add(\"assoc\", [\"AssociationLZ\", { url: \"file:///path/to/data.json\" }]);\n```\n\nRefer to the [Working with data guide](https://statgen.github.io/locuszoom/docs/guides/data_retrieval.html) for more information on using predefined data sources or extending/creating custom data sources.\n\n### 3. Define a Layout\n\n**Layout** is a serializable object that describes the configuration of the LocusZoom plot, including what data will be pulled from the data sources and displayed in what way, along with visual characteristics like color and geometry.\n\nA layout definition may look something like this (simplified example; consult docs for details):\n\n```javascript\nvar layout = {\n width: 500,\n height: 500,\n panels: [\n {\n id: \"association\",\n data_layers: [\n {\n id: \"association\",\n type: \"scatter\",\n x_axis: { field: \"assoc:position\" },\n y_axis: { field: \"assoc:pvalue\" }\n }\n ]\n }\n ]\n};\n```\n\nThe above example defines a basic plot that is 500 pixels on a side and has one panel with one scatter plot data layer that pulls in position and pvalue from the \"trait\" data source, mapping position to the x axis and pvalue to the y axis.\n\nThe LocusZoom.js library provides several pre-defined layouts for entire plots and subdivisions of plots such as panels, data layers, tool tips, etc. Refer to the [Layouts and visualization options guide](https://statgen.github.io/locuszoom/guides/rendering_layouts.html) for more information.\n\n### 4. Put it Together with `LocusZoom.populate()`\n\nWith includes included, data sources defined, and a layout defined, `LocusZoom.populate()` will accept a CSS selector string to populate the first matching element with a plot.\n\nA basic example may then look like this:\n\n```html\n\n \n \n \n \n \n \n \n \n\n```\n\n### Other Ways To Make a LocusZoom Plot\n\n#### Use a Predefined Layout\n\nThe core LocusZoom library comes equipped with several predefined layouts, organized by type (\"plot\", \"panel\", \"data_layer\", and \"toolbar\"). You can see what layouts are predefined by reading the [documentation](https://statgen.github.io/locuszoom/docs/api/module-LocusZoom_Layouts.html) or introspecting in the browser by entering `LocusZoom.Layouts.list()` (or to list one specific type, like \"data_layer\": `LocusZoom.Layouts.list(type)`).\n\nGet any predefined layout by type and name using `LocusZoom.Layouts.get(type, name)`.\n\nIf your data matches the field names and formats of the [UMich PortalDev API](https://portaldev.sph.umich.edu/docs/api/v1/#overview-of-api-endpoints), these layouts will provide a quick way to get started. If your data obeys different format rules, customization may be necessary. (for example, some LocusZoom features assume the presence of a field called `log_pvalue`)\n \nSee the [guide to working with layouts](https://statgen.github.io/locuszoom/docs/guides/rendering_layouts.html) for further details.\n\n#### Build a Layout Using Some Predefined Pieces\n\n`LocusZoom.Layouts.get(type, name)` can also be used to pull predefined layouts of smaller pieces, like data layers or \ntoolbars, into a custom layout:\n\n```javascript\nconst layout = {\n width: 1000,\n height: 500,\n panels: [\n LocusZoom.Layouts.get(\"panel\", \"association\"),\n {\n id: \"custom_panel\",\n ...options\n },\n LocusZoom.Layouts.get(\"panel\", \"genes\")\n ],\n ...\n};\n```\n\n#### Modify a Predefined Layout\n\nThe `get()` function also accepts a partial layout to be merged with the predefined layout as a third argument, providing the ability to use predefined layouts as starting points for custom layouts with only minor differences. Example:\n\n```javascript\nconst overrides = { label_font_size: 20 };\nLocusZoom.Layouts.get(\"data_layer\", \"genes\", overrides);\n```\n\n#### Predefining State by Building a State Object\n\n**State** is a serializable JSON object that describes orientation to specific data from data sources, and specific interactions with the layout. This can include a specific query against various data sources or pre-selecting specific elements. Essentially, the state object is what tracks these types of user input under the hood in LocusZoom, and it can be predefined at initialization as a top-level parameter in the layout. For example:\n\n```javascript\nconst layout = LocusZoom.Layouts.get('plot', 'standard_association', { state: { chr: 6, start: 20379709, end: 20979709 } })\n```\n\n#### Predefining State With `data-region`\n\nYou can also describe the locus query aspect of the State (chromosome, start, and end position) using a `data-region` attribute of the containing element before populating it, like so:\n\n```html\n\n```\n\nWhen `LocusZoom.populate()` is executed on the element defined above it will automatically parse any `data-region` parameter to convert those values into the initial state.\n\n## Development Setup\n\n### Dependencies\n\nLocusZoom is an entirely client-side library designed to plug into arbitrary data sets, be they local files, APIs, or something else entirely. It has the following external dependencies:\n\n* [d3](http://d3js.org/) for data visualization\n\n### Build System and Automated Testing\n\nLocusZoom is bundled using Webpack. To install all necessary dependencies for a development environment, run:\n\n```bash\n$ npm install\n```\n\nWe recommend using node.js v12 or greater to build the library and run tests.\n\nOnce complete run `npm run build` from the top of the application directory to run all tests and build the LocusZoom library bundle.\n\nThis build process will also write sourcemaps, to help with debugging code even in production environments.\n\n#### Other supported build commands:\n\n* `npm run test` - Run unit tests (optional: `npm run test:coverage` to output a code coverage report)\n* `npm run dev` - Automatically rebuild the library whenever code changes (development mode)\n* `npm run build` - Run tests, and if they pass, build the library for release\n* `npm run css` - Rebuild the CSS using SASS\n* `npm run docs` - Build the library documentation\n\n\n#### Automated Testing\n\nLocusZoom uses [Mocha](https://mochajs.org/) for unit testing. Tests are located in the `test` subdirectory. Use `npm run test`.\n\n### Static analysis and code style\nLocusZoom runs code quality checks via [ESLint](http://eslint.org/), the rules for which can be found in `.eslintrc`. This will run automatically as part of all new code commits, and during every build. \n\n## Help and Support\n\nFull API documentation and prose guides are available at: [https://statgen.github.io/locuszoom/docs/](https://statgen.github.io/locuszoom/docs/)\n\nA LocusZoom discussion forum is available here: [https://groups.google.com/forum/#!forum/locuszoom](https://groups.google.com/forum/#!forum/locuszoom). \nFor the most effective help, please specify that your question is about \"LocusZoom.js\".\n\nIf you have questions or feedback please file an issue on the [LocusZoom.js GitHub repository](https://github.com/statgen/locuszoom/issues) or post at the discussion forum referenced above.\n","readmeFilename":"README.md","gitHead":"cc18ae3b2ab24f64f318b092555e89f643251aed","bugs":{"url":"https://github.com/statgen/locuszoom/issues"},"_id":"locuszoom@0.14.0-beta.2","_nodeVersion":"12.22.1","_npmVersion":"6.14.12","dist":{"integrity":"sha512-EV0G2I0os+0izQpVKc5zvhmTUxZKzKZN2UuYJayR9hH8dd4wLO/RtwwiSq+CjXt85o2d5k+mPiocouHbZ5rBKw==","shasum":"893ddbe068da14c6a4940928ed3b5c5d05cac631","tarball":"https://registry.npmjs.org/locuszoom/-/locuszoom-0.14.0-beta.2.tgz","fileCount":323,"unpackedSize":8860566,"npm-signature":"-----BEGIN PGP SIGNATURE-----\r\nVersion: OpenPGP.js v3.0.13\r\nComment: https://openpgpjs.org\r\n\r\nwsFcBAEBCAAQBQJhl9G0CRA9TVsSAnZWagAAz+0P/05NNKrkw46DijzkE6k8\n1NwJdVTz9M00ZmUf0yteUiLgRLkQ1i0C+rD1kZ7b/w+iSAJ/KHkmrUDDPYMW\nsWXtcbgoqddgkTFI0R9RhdzIJCR/EEKKZKVRW/x3/TPGe+MHaccyo4J8n46Y\nqL1LY/3iUXQiKBfmJUo5Uo5ZGcnP2J1InhUghtIV/FQe2FPbFRlSZy4J+KVv\nNdjejyJ05Nc0VMxrWB+wPcanBuomUzWU5bPOLB/gdWBJXqQzy0o4A1/6rT51\nX/N9R4ZGL7AwVgL6sub0fOjurUrsUkW+AF06Ic1EG9YWtNKw1XjGNpvvtUxV\n30TuOtMTtz1EK1EcDInm4wwkInP9jB6WohTK7IfE6MK07Y+kvHHD9FOmMmEa\n4uTtTmqVUtrL2quTXj3DGFr3O9CGHbbeZ4IQEQDuGxFlFZqr87xuxMUgvIrk\nLzq7nCYpDdppaXtvBfkAjwS0vVmQAO5RJ8yxUMhcind+9eqjtAFcq81RZXT2\nOUg7ZKeCIY/MN7jzZ5O7DfrHpsIRL6wqf3POyKRI20Dj7AtIWsVaJuSWab6g\n3ge1xpTboDyCtClFiSIcH7WP1S3ZfIB9AtbwnObt9WTT0VXJgAIS+lZmUQXI\ng+r769bIcFyAd4U/dl5Fr/Khn01IEjfUqs/OsEDFTSdgnjKFxadvWrQhbd5S\njV0K\r\n=lXGO\r\n-----END PGP SIGNATURE-----\r\n","signatures":[{"keyid":"SHA256:jl3bwswu80PjjokCgh0o2w5c2U4LhQAE57gj9cz1kzA","sig":"MEQCIHY9elVwVCORZWpU2sdKJ+1Repcpw7wSulGCcbt8+CcJAiB7SKg7fkl5kwbvdIqsoWGqeC4V0Grzc/sAyEbP7sC/Dw=="}]},"_npmUser":{"name":"abought","email":"abought@gmail.com"},"directories":{},"maintainers":[{"name":"frencil","email":"frencils@gmail.com"},{"name":"abought","email":"abought@gmail.com"},{"name":"welchr","email":"welchr@umich.edu"}],"_npmOperationalInternal":{"host":"s3://npm-registry-packages","tmp":"tmp/locuszoom_0.14.0-beta.2_1637339572671_0.987555222158071"},"_hasShrinkwrap":false},"0.14.0-beta.3":{"name":"locuszoom","version":"0.14.0-beta.3","main":"dist/locuszoom.app.min.js","module":"esm/index.js","sideEffects":true,"description":"Generate interactive visualizations of statistical genetic data","keywords":["visualization","genetics","genes","gwas","phewas"],"homepage":"https://github.com/statgen/locuszoom","license":"MIT","author":{"name":"University of Michigan Center for Statistical Genetics"},"contributors":[{"name":"Christopher Clark"},{"name":"Matthew Flickinger"},{"name":"Ryan Welch"},{"name":"Peter VandeHaar"},{"name":"Andy Boughton","email":"abought@umich.edu"}],"engines":{"node":">=10.13.0"},"repository":{"type":"git","url":"git+https://github.com/statgen/locuszoom.git"},"scripts":{"echo_version":"echo \"export default '${npm_package_version}';\" > esm/version.js","test":"eslint esm/ test/ && mocha --recursive test","test:coverage":"nyc --reporter=text mocha --recursive test/**/*.js","css":"sass --style compressed ./css/locuszoom.scss ./dist/locuszoom.css","dev":"npm run css && webpack --watch --config webpack.dev.cjs","build":"npm run echo_version && npm run test && npm run css && webpack --config webpack.prod.cjs && npm run docs","docs":"./build_docs.sh"},"dependencies":{"@hapi/topo":"^5.1.0","d3":"^5.16.0","gwas-credible-sets":"^0.1.0","just-clone":"^3.2.1","tabix-reader":"^1.0.1"},"devDependencies":{"@babel/core":"^7.13.1","@babel/preset-env":"^7.13.5","@babel/register":"^7.13.0","babel-loader":"^8.2.2","babel-plugin-module-resolver":"^4.1.0","chai":"^4.3.0","clean-webpack-plugin":"^3.0.0","eslint":"^7.32.0","eslint-webpack-plugin":"^2.5.2","friendly-errors-webpack-plugin":"^1.7.0","jsdoc":"^3.6.7","jsdom":"^16.4.0","jsdom-global":"^3.0.2","mocha":"^8.3.0","nyc":"^15.1.0","sass":"^1.32.8","sass-loader":"^11.0.1","sinon":"^6.3.5","source-map-loader":"^2.0.1","webpack":"^5.24.2","webpack-cli":"^4.5.0","webpack-merge":"^5.7.3"},"readme":"# LocusZoom\n\nLocusZoom is a Javascript/d3 embeddable plugin for interactively visualizing statistical genetic data from customizable sources.\n\n\nFor more information, see our paper:\n\n*Boughton, A. P. et al. LocusZoom.js: interactive and embeddable visualization of genetic association study results. Bioinformatics (2021) [doi:10.1093/bioinformatics/btab186](https://doi.org/10.1093/bioinformatics/btab186).*\n\n**This is a low level library aimed at developers who want to customize their own data sharing/visualization tools. If you are a genetics researcher who just wants to make a fast visualization of your research results, try our user-friendly plot-your-own data services built on LocusZoom.js: [my.locuszoom.org](https://my.locuszoom.org/) and [LocalZoom](https://statgen.github.io/localzoom/)**.\n\n\n\n\nSee [https://statgen.github.io/locuszoom/docs/](https://statgen.github.io/locuszoom/docs/) for full documentation and API reference.\n\nTo see functional examples of plots generated with LocusZoom.js see [statgen.github.io/locuszoom](http://statgen.github.io/locuszoom/) and [statgen.github.io/locuszoom/#examples](http://statgen.github.io/locuszoom/#examples).\n\n\n\n## Making a LocusZoom Plot: Quickstart tutorial\n\n### 1. Include Necessary JavaScript and CSS\n\nThe page you build that embeds the LocusZoom plugin must include the following resources, found in the `dist` directory (or preferably loaded via CDN):\n\n* `d3.js` \n [D3.js](https://d3js.org/) v5.16.0 is used to draw graphics in LocusZoom plots. It may be loaded [via a CDN](https://cdn.jsdelivr.net/npm/d3@^5.16.0). It must be present before LocusZoom is loaded.\n\n* `locuszoom.app.min.js` \n This is the primary application logic. It should only be included *after* the vendor dependencies have been included. \n\n* `locuszoom.css` \n This is the primary stylesheet. It is namespaced so as not to conflict with any other styles defined on the same page.\n\nInstead of copying the files to your project, **we recommend using CDN links are for these resources** (see [statgen.github.io/locuszoom/](http://statgen.github.io/locuszoom/)).\n\n*The above instructions describe using LocusZoom with pure JS and HTML. If you are using a module build system, LocusZoom supports usage via ES6 imports, eg:* \n\n```javascript\nimport LocusZoom from 'locuszoom';\nimport 'locuszoom/dist/locuszoom.css';\n```\n\n### 2. Define Data Sources\n\n**Data Sources** is an object representing a collection of arbitrarily many sources from which data for the plot can be requested. When adding sources to the collection they must be namespaced so that retrieving specific fields can be done with respect to specific data sources.\n\nHere's an example of defining a data sources object for a remote API:\n\n```javascript\nvar data_sources = new LocusZoom.DataSources();\ndata_sources.add(\"assoc\", [\"AssociationLZ\", { url: \"http://server.com/api/\", source: 1 }]);\n```\n\nThe above example adds an \"AssociationLZ\" data source (a predefined data source designed to make requests for association data) with a defined URL. The namespace for this data source is \"assoc\".\n\nData sources can also be local files:\n\n```javascript\ndata_sources = new LocusZoom.DataSources();\ndata_sources.add(\"assoc\", [\"AssociationLZ\", { url: \"file:///path/to/data.json\" }]);\n```\n\nRefer to the [Working with data guide](https://statgen.github.io/locuszoom/docs/guides/data_retrieval.html) for more information on using predefined data sources or extending/creating custom data sources.\n\n### 3. Define a Layout\n\n**Layout** is a serializable object that describes the configuration of the LocusZoom plot, including what data will be pulled from the data sources and displayed in what way, along with visual characteristics like color and geometry.\n\nA layout definition may look something like this (simplified example; consult docs for details):\n\n```javascript\nvar layout = {\n width: 500,\n height: 500,\n panels: [\n {\n id: \"association\",\n data_layers: [\n {\n id: \"association\",\n type: \"scatter\",\n x_axis: { field: \"assoc:position\" },\n y_axis: { field: \"assoc:pvalue\" }\n }\n ]\n }\n ]\n};\n```\n\nThe above example defines a basic plot that is 500 pixels on a side and has one panel with one scatter plot data layer that pulls in position and pvalue from the \"trait\" data source, mapping position to the x axis and pvalue to the y axis.\n\nThe LocusZoom.js library provides several pre-defined layouts for entire plots and subdivisions of plots such as panels, data layers, tool tips, etc. Refer to the [Layouts and visualization options guide](https://statgen.github.io/locuszoom/guides/rendering_layouts.html) for more information.\n\n### 4. Put it Together with `LocusZoom.populate()`\n\nWith includes included, data sources defined, and a layout defined, `LocusZoom.populate()` will accept a CSS selector string to populate the first matching element with a plot.\n\nA basic example may then look like this:\n\n```html\n\n \n \n \n \n \n \n \n \n\n```\n\n### Other Ways To Make a LocusZoom Plot\n\n#### Use a Predefined Layout\n\nThe core LocusZoom library comes equipped with several predefined layouts, organized by type (\"plot\", \"panel\", \"data_layer\", and \"toolbar\"). You can see what layouts are predefined by reading the [documentation](https://statgen.github.io/locuszoom/docs/api/module-LocusZoom_Layouts.html) or introspecting in the browser by entering `LocusZoom.Layouts.list()` (or to list one specific type, like \"data_layer\": `LocusZoom.Layouts.list(type)`).\n\nGet any predefined layout by type and name using `LocusZoom.Layouts.get(type, name)`.\n\nIf your data matches the field names and formats of the [UMich PortalDev API](https://portaldev.sph.umich.edu/docs/api/v1/#overview-of-api-endpoints), these layouts will provide a quick way to get started. If your data obeys different format rules, customization may be necessary. (for example, some LocusZoom features assume the presence of a field called `log_pvalue`)\n \nSee the [guide to working with layouts](https://statgen.github.io/locuszoom/docs/guides/rendering_layouts.html) for further details.\n\n#### Build a Layout Using Some Predefined Pieces\n\n`LocusZoom.Layouts.get(type, name)` can also be used to pull predefined layouts of smaller pieces, like data layers or \ntoolbars, into a custom layout:\n\n```javascript\nconst layout = {\n width: 1000,\n height: 500,\n panels: [\n LocusZoom.Layouts.get(\"panel\", \"association\"),\n {\n id: \"custom_panel\",\n ...options\n },\n LocusZoom.Layouts.get(\"panel\", \"genes\")\n ],\n ...\n};\n```\n\n#### Modify a Predefined Layout\n\nThe `get()` function also accepts a partial layout to be merged with the predefined layout as a third argument, providing the ability to use predefined layouts as starting points for custom layouts with only minor differences. Example:\n\n```javascript\nconst overrides = { label_font_size: 20 };\nLocusZoom.Layouts.get(\"data_layer\", \"genes\", overrides);\n```\n\n#### Predefining State by Building a State Object\n\n**State** is JSON-serializable object containing information that can affect the entire plot (including all data retrieval requests). State can be set before or after the plot is initialized. For example, the following special-named fields will cause the plot to be loaded to a specific region of interest on first render:\n\n```javascript\nconst layout = LocusZoom.Layouts.get('plot', 'standard_association', { state: { chr: 6, start: 20379709, end: 20979709 } })\n```\n\n#### Alternate: setting the initial view via `data-region`\n\nYou can also describe the locususing a `data-region` attribute of the containing element before populating it, like so:\n\n```html\n\n```\n\nWhen `LocusZoom.populate()` is executed on the element defined above it will automatically parse any `data-region` parameter to convert those values into the initial state.\n\n## Development Setup\n### Dependencies\n\nLocusZoom is an entirely client-side library designed to plug into arbitrary data sets, be they local files, APIs, or something else entirely. It has the following external dependencies:\n\n* [d3](http://d3js.org/) for data visualization\n\n### Build System and Automated Testing\n\nLocusZoom is bundled using Webpack. To install all necessary dependencies for a development environment, run:\n\n```bash\n$ npm install\n```\n\nWe recommend using node.js v12 or greater to build the library and run tests.\n\nOnce complete run `npm run build` from the top of the application directory to run all tests and build the LocusZoom library bundle.\n\nThis build process will also write sourcemaps, to help with debugging code even in production environments.\n\n#### Other supported build commands:\n\n* `npm run test` - Run unit tests (optional: `npm run test:coverage` to output a code coverage report)\n* `npm run dev` - Automatically rebuild the library whenever code changes (development mode)\n* `npm run build` - Run tests, and if they pass, build the library for release\n* `npm run css` - Rebuild the CSS using SASS (CSS rarely changes, so this doesn't get done automatically in dev mode)\n* `npm run docs` - Build just the library documentation\n\n\n#### Automated Testing\n\nLocusZoom uses [Mocha](https://mochajs.org/) for unit testing. Tests are located in the `test` subdirectory. Use `npm run test`.\n\n### Static analysis and code style\nLocusZoom runs code quality checks via [ESLint](http://eslint.org/), the rules for which can be found in `.eslintrc`. This will run automatically as part of all new code commits, and during every build. \n\n## Help and Support\n\nFull API documentation and prose guides are available at: [https://statgen.github.io/locuszoom/docs/](https://statgen.github.io/locuszoom/docs/)\n\nA LocusZoom discussion forum is available here: [https://groups.google.com/forum/#!forum/locuszoom](https://groups.google.com/forum/#!forum/locuszoom). \nFor the most effective help, please specify that your question is about \"LocusZoom.js\".\n\nIf you have questions or feedback please file an issue on the [LocusZoom.js GitHub repository](https://github.com/statgen/locuszoom/issues) or post at the discussion forum referenced above.\n","readmeFilename":"README.md","gitHead":"4247c68204d20f43569aebc94050287c1058d127","bugs":{"url":"https://github.com/statgen/locuszoom/issues"},"_id":"locuszoom@0.14.0-beta.3","_nodeVersion":"12.22.1","_npmVersion":"6.14.12","dist":{"integrity":"sha512-+GPuO6+szuVkKI2d2H2sj1TKL3/WOrNiPrH5fPC0HOIAzdW9q25vGOlmm1yb2Sbr473cVkcacJqZ5yT0yTZHpQ==","shasum":"9278bf8eaf1cea72f4a2127375ce7750b6ddb85f","tarball":"https://registry.npmjs.org/locuszoom/-/locuszoom-0.14.0-beta.3.tgz","fileCount":344,"unpackedSize":9178051,"npm-signature":"-----BEGIN PGP SIGNATURE-----\r\nVersion: OpenPGP.js v3.0.13\r\nComment: https://openpgpjs.org\r\n\r\nwsFcBAEBCAAQBQJh83V7CRA9TVsSAnZWagAA/akP/jWbjr987JA70YM0W5gc\nj5kqLH4X5PozMr+5XlrtVxnxcwjc/bwj+H9sQJJUR1WbFpY+/0Z/4MgbA7PA\nP92i3Cg5XRkcpNwNWZfrYahWAMejUKEtV8ZcaLVlALneqb/hlex4j9suOn7a\nj/TmIfzszQOMvBmm5YtBwLKoaF/2fQiWIf13wNaWYlL1IW5xY0HBvhbPlMId\n1l/tqzbhZvxHqoDA2vulBQdW9/RwVVoe2g+NEBWKPYJhnV7KEB3W8iWZLXzR\nAQHIEew2ePZQXhKUsoEogNXe5M0x/wpl10wTbSv+seadr5M1HROjSQY6YL5E\nuZYyrbPujvyj5GcRjpX/g7Bp/8boYlZfcZF3mFr4xYcVLYUESohnX0/tXJgH\njlMOWd6fx8BVVF9NK+135LGDisacKk7E7xnZXru1PkuMW1D8vw8Jcoo6p+6S\n0YMZnAGUMwhDPxWpwNYFGHkVXWAOkDEH31zNCLyPXeOcGwQaFhy8AzBgQMhV\nREiCgDCvsLI/aLC6YvmtZRMQoOE6ykjX2bLCqrtBFPFw1XTuvE5N5tPRZwuS\n6SeHCLnaByl0JW6wU1BPQ9evQNvMacmbzZQKNoxiMsElzh6egHIPW8wA1srL\n4o+EOOq8pi8+BDBsPqsKLqfO9PltMaAtnul/psspUab9H5hZ5GD7jQ/907iQ\n3XF0\r\n=0UkH\r\n-----END PGP SIGNATURE-----\r\n","signatures":[{"keyid":"SHA256:jl3bwswu80PjjokCgh0o2w5c2U4LhQAE57gj9cz1kzA","sig":"MEQCIAaF3DzMzxgpXt9IFq4MMMZRB6uIlS01RWEGPJbwHcEqAiA3QNJn2oLMputSprVVUy6eD4743e8dwNDBerGfHUG/sg=="}]},"_npmUser":{"name":"abought","email":"abought@gmail.com"},"directories":{},"maintainers":[{"name":"frencil","email":"frencils@gmail.com"},{"name":"abought","email":"abought@gmail.com"},{"name":"welchr","email":"welchr@umich.edu"}],"_npmOperationalInternal":{"host":"s3://npm-registry-packages","tmp":"tmp/locuszoom_0.14.0-beta.3_1643345275369_0.4650328509807071"},"_hasShrinkwrap":false},"0.14.0-beta.4":{"name":"locuszoom","version":"0.14.0-beta.4","main":"dist/locuszoom.app.min.js","module":"esm/index.js","sideEffects":true,"description":"Generate interactive visualizations of statistical genetic data","keywords":["visualization","genetics","genes","gwas","phewas"],"homepage":"https://github.com/statgen/locuszoom","license":"MIT","author":{"name":"University of Michigan Center for Statistical Genetics"},"contributors":[{"name":"Christopher Clark"},{"name":"Matthew Flickinger"},{"name":"Ryan Welch"},{"name":"Peter VandeHaar"},{"name":"Andy Boughton","email":"abought@umich.edu"}],"engines":{"node":">=10.13.0"},"repository":{"type":"git","url":"git+https://github.com/statgen/locuszoom.git"},"scripts":{"echo_version":"echo \"export default '${npm_package_version}';\" > esm/version.js","test":"eslint esm/ test/ && mocha --recursive test","test:coverage":"nyc --reporter=text mocha --recursive test/**/*.js","css":"sass --style compressed ./css/locuszoom.scss ./dist/locuszoom.css","dev":"npm run css && webpack --watch --config webpack.dev.cjs","build":"npm run echo_version && npm run test && npm run css && webpack --config webpack.prod.cjs && npm run docs","docs":"./build_docs.sh"},"dependencies":{"@hapi/topo":"^5.1.0","d3":"^5.16.0","gwas-credible-sets":"^0.1.0","just-clone":"^3.2.1","tabix-reader":"^1.0.1"},"devDependencies":{"@babel/core":"^7.13.1","@babel/preset-env":"^7.13.5","@babel/register":"^7.13.0","babel-loader":"^8.2.2","babel-plugin-module-resolver":"^4.1.0","chai":"^4.3.0","clean-webpack-plugin":"^3.0.0","eslint":"^7.32.0","eslint-webpack-plugin":"^2.5.2","friendly-errors-webpack-plugin":"^1.7.0","jsdoc":"^3.6.10","jsdom":"^16.4.0","jsdom-global":"^3.0.2","mocha":"^8.3.0","nyc":"^15.1.0","sass":"^1.32.8","sass-loader":"^11.0.1","sinon":"^6.3.5","source-map-loader":"^2.0.1","webpack":"^5.24.2","webpack-cli":"^4.5.0","webpack-merge":"^5.7.3"},"readme":"# LocusZoom\n\nLocusZoom is a Javascript/d3 embeddable plugin for interactively visualizing statistical genetic data from customizable sources.\n\n\nFor more information, see our paper:\n\n*Boughton, A. P. et al. LocusZoom.js: interactive and embeddable visualization of genetic association study results. Bioinformatics (2021) [doi:10.1093/bioinformatics/btab186](https://doi.org/10.1093/bioinformatics/btab186).*\n\n**This is a low level library aimed at developers who want to customize their own data sharing/visualization tools. If you are a genetics researcher who just wants to make a fast visualization of your research results, try our user-friendly plot-your-own data services built on LocusZoom.js: [my.locuszoom.org](https://my.locuszoom.org/) and [LocalZoom](https://statgen.github.io/localzoom/)**.\n\n\n\n\nSee [https://statgen.github.io/locuszoom/docs/](https://statgen.github.io/locuszoom/docs/) for full documentation and API reference.\n\nTo see functional examples of plots generated with LocusZoom.js see [statgen.github.io/locuszoom](http://statgen.github.io/locuszoom/) and [statgen.github.io/locuszoom/#examples](http://statgen.github.io/locuszoom/#examples).\n\n\n\n## Making a LocusZoom Plot: Quickstart tutorial\n\n### 1. Include Necessary JavaScript and CSS\n\nThe page you build that embeds the LocusZoom plugin must include the following resources, found in the `dist` directory (or preferably loaded via CDN):\n\n* `d3.js` \n [D3.js](https://d3js.org/) v5.16.0 is used to draw graphics in LocusZoom plots. It may be loaded [via a CDN](https://cdn.jsdelivr.net/npm/d3@^5.16.0). It must be present before LocusZoom is loaded.\n\n* `locuszoom.app.min.js` \n This is the primary application logic. It should only be included *after* the vendor dependencies have been included. \n\n* `locuszoom.css` \n This is the primary stylesheet. It is namespaced so as not to conflict with any other styles defined on the same page.\n\nInstead of copying the files to your project, **we recommend using CDN links are for these resources** (see [statgen.github.io/locuszoom/](http://statgen.github.io/locuszoom/)).\n\n*The above instructions describe using LocusZoom with pure JS and HTML. If you are using a module build system, LocusZoom supports usage via ES6 imports, eg:* \n\n```javascript\nimport LocusZoom from 'locuszoom';\nimport 'locuszoom/dist/locuszoom.css';\n```\n\n### 2. Define Data Sources\n\n**Data Sources** is an object representing a collection of arbitrarily many sources from which data for the plot can be requested. When adding sources to the collection they must be namespaced so that retrieving specific fields can be done with respect to specific data sources.\n\nHere's an example of defining a data sources object for a remote API:\n\n```javascript\nvar data_sources = new LocusZoom.DataSources();\ndata_sources.add(\"assoc\", [\"AssociationLZ\", { url: \"http://server.com/api/\", source: 1 }]);\n```\n\nThe above example adds an \"AssociationLZ\" data source (a predefined data source designed to make requests for association data) with a defined URL. The namespace for this data source is \"assoc\".\n\nData sources can also be local files:\n\n```javascript\ndata_sources = new LocusZoom.DataSources();\ndata_sources.add(\"assoc\", [\"AssociationLZ\", { url: \"file:///path/to/data.json\" }]);\n```\n\nRefer to the [Working with data guide](https://statgen.github.io/locuszoom/docs/guides/data_retrieval.html) for more information on using predefined data sources or extending/creating custom data sources.\n\n### 3. Define a Layout\n\n**Layout** is a serializable object that describes the configuration of the LocusZoom plot, including what data will be pulled from the data sources and displayed in what way, along with visual characteristics like color and geometry.\n\nA layout definition may look something like this (simplified example; consult docs for details):\n\n```javascript\nvar layout = {\n width: 500,\n height: 500,\n panels: [\n {\n id: \"association\",\n data_layers: [\n {\n id: \"association\",\n type: \"scatter\",\n x_axis: { field: \"assoc:position\" },\n y_axis: { field: \"assoc:pvalue\" }\n }\n ]\n }\n ]\n};\n```\n\nThe above example defines a basic plot that is 500 pixels on a side and has one panel with one scatter plot data layer that pulls in position and pvalue from the \"trait\" data source, mapping position to the x axis and pvalue to the y axis.\n\nThe LocusZoom.js library provides several pre-defined layouts for entire plots and subdivisions of plots such as panels, data layers, tool tips, etc. Refer to the [Layouts and visualization options guide](https://statgen.github.io/locuszoom/guides/rendering_layouts.html) for more information.\n\n### 4. Put it Together with `LocusZoom.populate()`\n\nWith includes included, data sources defined, and a layout defined, `LocusZoom.populate()` will accept a CSS selector string to populate the first matching element with a plot.\n\nA basic example may then look like this:\n\n```html\n\n \n \n \n \n \n \n \n \n\n```\n\n### Other Ways To Make a LocusZoom Plot\n\n#### Use a Predefined Layout\n\nThe core LocusZoom library comes equipped with several predefined layouts, organized by type (\"plot\", \"panel\", \"data_layer\", and \"toolbar\"). You can see what layouts are predefined by reading the [documentation](https://statgen.github.io/locuszoom/docs/api/module-LocusZoom_Layouts.html) or introspecting in the browser by entering `LocusZoom.Layouts.list()` (or to list one specific type, like \"data_layer\": `LocusZoom.Layouts.list(type)`).\n\nGet any predefined layout by type and name using `LocusZoom.Layouts.get(type, name)`.\n\nIf your data matches the field names and formats of the [UMich PortalDev API](https://portaldev.sph.umich.edu/docs/api/v1/#overview-of-api-endpoints), these layouts will provide a quick way to get started. If your data obeys different format rules, customization may be necessary. (for example, some LocusZoom features assume the presence of a field called `log_pvalue`)\n \nSee the [guide to working with layouts](https://statgen.github.io/locuszoom/docs/guides/rendering_layouts.html) for further details.\n\n#### Build a Layout Using Some Predefined Pieces\n\n`LocusZoom.Layouts.get(type, name)` can also be used to pull predefined layouts of smaller pieces, like data layers or \ntoolbars, into a custom layout:\n\n```javascript\nconst layout = {\n width: 1000,\n height: 500,\n panels: [\n LocusZoom.Layouts.get(\"panel\", \"association\"),\n {\n id: \"custom_panel\",\n ...options\n },\n LocusZoom.Layouts.get(\"panel\", \"genes\")\n ],\n ...\n};\n```\n\n#### Modify a Predefined Layout\n\nThe `get()` function also accepts a partial layout to be merged with the predefined layout as a third argument, providing the ability to use predefined layouts as starting points for custom layouts with only minor differences. Example:\n\n```javascript\nconst overrides = { label_font_size: 20 };\nLocusZoom.Layouts.get(\"data_layer\", \"genes\", overrides);\n```\n\n#### Predefining State by Building a State Object\n\n**State** is JSON-serializable object containing information that can affect the entire plot (including all data retrieval requests). State can be set before or after the plot is initialized. For example, the following special-named fields will cause the plot to be loaded to a specific region of interest on first render:\n\n```javascript\nconst layout = LocusZoom.Layouts.get('plot', 'standard_association', { state: { chr: 6, start: 20379709, end: 20979709 } })\n```\n\n#### Alternate: setting the initial view via `data-region`\n\nYou can also describe the locususing a `data-region` attribute of the containing element before populating it, like so:\n\n```html\n\n```\n\nWhen `LocusZoom.populate()` is executed on the element defined above it will automatically parse any `data-region` parameter to convert those values into the initial state.\n\n## Development Setup\n### Dependencies\n\nLocusZoom is an entirely client-side library designed to plug into arbitrary data sets, be they local files, APIs, or something else entirely. It has the following external dependencies:\n\n* [d3](http://d3js.org/) for data visualization\n\n### Build System and Automated Testing\n\nLocusZoom is bundled using Webpack. To install all necessary dependencies for a development environment, run:\n\n```bash\n$ npm install\n```\n\nWe recommend using node.js v12 or greater to build the library and run tests.\n\nOnce complete run `npm run build` from the top of the application directory to run all tests and build the LocusZoom library bundle.\n\nThis build process will also write sourcemaps, to help with debugging code even in production environments.\n\n#### Other supported build commands:\n\n* `npm run test` - Run unit tests (optional: `npm run test:coverage` to output a code coverage report)\n* `npm run dev` - Automatically rebuild the library whenever code changes (development mode)\n* `npm run build` - Run tests, and if they pass, build the library for release\n* `npm run css` - Rebuild the CSS using SASS (CSS rarely changes, so this doesn't get done automatically in dev mode)\n* `npm run docs` - Build just the library documentation\n\n\n#### Automated Testing\n\nLocusZoom uses [Mocha](https://mochajs.org/) for unit testing. Tests are located in the `test` subdirectory. Use `npm run test`.\n\n### Static analysis and code style\nLocusZoom runs code quality checks via [ESLint](http://eslint.org/), the rules for which can be found in `.eslintrc`. This will run automatically as part of all new code commits, and during every build. \n\n## Help and Support\n\nFull API documentation and prose guides are available at: [https://statgen.github.io/locuszoom/docs/](https://statgen.github.io/locuszoom/docs/)\n\nA LocusZoom discussion forum is available here: [https://groups.google.com/forum/#!forum/locuszoom](https://groups.google.com/forum/#!forum/locuszoom). \nFor the most effective help, please specify that your question is about \"LocusZoom.js\".\n\nIf you have questions or feedback please file an issue on the [LocusZoom.js GitHub repository](https://github.com/statgen/locuszoom/issues) or post at the discussion forum referenced above.\n","readmeFilename":"README.md","gitHead":"674d25cc7fb338ff6c2b378e538e6de2b0ec5a8a","bugs":{"url":"https://github.com/statgen/locuszoom/issues"},"_id":"locuszoom@0.14.0-beta.4","_nodeVersion":"12.22.1","_npmVersion":"6.14.12","dist":{"integrity":"sha512-w9lwzURSLPHRHU8QxkaL4+fmkTDGwEthtuxj4n/qFOYeuv5wwJCtuqlfvzq9pn6egGTTMpwFITnAj+EMg2Yh2A==","shasum":"6b00f1f78b5c7105728a330262e741a2e1afad64","tarball":"https://registry.npmjs.org/locuszoom/-/locuszoom-0.14.0-beta.4.tgz","fileCount":344,"unpackedSize":9178374,"npm-signature":"-----BEGIN PGP SIGNATURE-----\r\nVersion: OpenPGP.js v4.10.10\r\nComment: https://openpgpjs.org\r\n\r\nwsFzBAEBCAAGBQJiHQ+sACEJED1NWxICdlZqFiEECWMYAoorWMhJKdjhPU1b\r\nEgJ2Vmq/mg/+MoZtWauBeZzZBwIlmePcJ8a2SfD+uCj1LI1SGEm9VHXJ1FW1\r\n7xk2iPjSu/YTu0Ki66AQt6GrFnC0fJDrUYG6QeVagplye5eZK8B++3TIjp7C\r\ndLRjYDj/Uv3ahIJ8PB1HNzewB1cqsgQzD+v13fzc2L7dEQkivp+6nmDNN+R1\r\nNnS4RmRw+i+Ln6aeJQKzRdYiDw8hycRoj7hWCEcoiMjid8vFfrUjVmpvKVns\r\nvodI9/AU9V3XA+TKU2HxkWmtlTGs/VhGdVpmnHRepkwX2z6Fx/ZIWyLozyCL\r\nwSrGC8ufTd4UynUEXQXqQ2C70JSOkOgWQqA7s/DQq5I+FzaS2XFytIS8cjWY\r\ndGQ+ocNKs/aGwwemhD4pRj+KDSkVxn+LUq2zil65xOm0wEnpKBHwx1HHM3Wo\r\n8G1jqS/nLan+c/aj9uPgIf2Wi2cZFoKPQG5Eze20ePld4nzm0HqA30QMpohP\r\nJ9PrAJQHeTl0tQsePhuX/dKbqVfE6NNpXB5uqz7xLIy9hBYTW8cU5MXQyF5Y\r\nZQ300MbdAD3eRoLMTYATmzljgg+LIv0zslWrpGYMzj2o8t0QrKQEJLgXjHpL\r\nJ81iAkVqLh1MYIa6EZxalswp+pyxM9VnBjdrKsYf25eX2kImMreSo3oGJeXz\r\nHg/HqwGlQcwwHidn5gV/LOgUverw/ircWwk=\r\n=HBpG\r\n-----END PGP SIGNATURE-----\r\n","signatures":[{"keyid":"SHA256:jl3bwswu80PjjokCgh0o2w5c2U4LhQAE57gj9cz1kzA","sig":"MEUCIQC1tmXtSGtFR7rMsqjYYS9dUqnhj2/ipBANm1CBIlT+0gIgPq7ZzyStm1ZxWdgXawa0HMcj8563Uvw4h+/7fbKcxwc="}]},"_npmUser":{"name":"abought","email":"abought@gmail.com"},"directories":{},"maintainers":[{"name":"frencil","email":"frencils@gmail.com"},{"name":"abought","email":"abought@gmail.com"},{"name":"welchr","email":"welchr@umich.edu"}],"_npmOperationalInternal":{"host":"s3://npm-registry-packages","tmp":"tmp/locuszoom_0.14.0-beta.4_1646071724466_0.4433964842201146"},"_hasShrinkwrap":false},"0.14.0":{"name":"locuszoom","version":"0.14.0","main":"dist/locuszoom.app.min.js","module":"esm/index.js","sideEffects":true,"description":"Generate interactive visualizations of statistical genetic data","keywords":["visualization","genetics","genes","gwas","phewas"],"homepage":"https://github.com/statgen/locuszoom","license":"MIT","author":{"name":"University of Michigan Center for Statistical Genetics"},"contributors":[{"name":"Christopher Clark"},{"name":"Matthew Flickinger"},{"name":"Ryan Welch"},{"name":"Peter VandeHaar"},{"name":"Andy Boughton","email":"abought@umich.edu"}],"engines":{"node":">=10.13.0"},"repository":{"type":"git","url":"git+https://github.com/statgen/locuszoom.git"},"scripts":{"echo_version":"echo \"export default '${npm_package_version}';\" > esm/version.js","test":"eslint esm/ test/ && mocha --recursive test","test:coverage":"nyc --reporter=text mocha --recursive test/**/*.js","css":"sass --style compressed ./css/locuszoom.scss ./dist/locuszoom.css","dev":"npm run css && webpack --watch --config webpack.dev.cjs","build":"npm run echo_version && npm run test && npm run css && webpack --config webpack.prod.cjs && npm run docs","docs":"./build_docs.sh"},"dependencies":{"@hapi/topo":"^5.1.0","d3":"^5.16.0","gwas-credible-sets":"^0.1.0","just-clone":"^3.2.1","tabix-reader":"^1.0.1"},"devDependencies":{"@babel/core":"^7.13.1","@babel/preset-env":"^7.13.5","@babel/register":"^7.13.0","babel-loader":"^8.2.2","babel-plugin-module-resolver":"^4.1.0","chai":"^4.3.0","clean-webpack-plugin":"^3.0.0","eslint":"^7.32.0","eslint-webpack-plugin":"^2.5.2","friendly-errors-webpack-plugin":"^1.7.0","jsdoc":"^3.6.10","jsdom":"^16.4.0","jsdom-global":"^3.0.2","mocha":"^8.3.0","nyc":"^15.1.0","sass":"^1.32.8","sass-loader":"^11.0.1","sinon":"^6.3.5","source-map-loader":"^2.0.1","webpack":"^5.24.2","webpack-cli":"^4.5.0","webpack-merge":"^5.7.3"},"gitHead":"d13139dc9f251f6fd02052fc2241395e58a958b6","bugs":{"url":"https://github.com/statgen/locuszoom/issues"},"_id":"locuszoom@0.14.0","_nodeVersion":"12.22.1","_npmVersion":"6.14.12","dist":{"integrity":"sha512-zevo24rJzC82HjN1pXuEiSiYI3uAugftmv4nBZYV2T1bineeSEY69PZzDmd3EX2y8ru/hJHQJZAHmpZR7xTizw==","shasum":"f4cd5322c3b2b5eb0d5143deeeaa4e14c34e0e26","tarball":"https://registry.npmjs.org/locuszoom/-/locuszoom-0.14.0.tgz","fileCount":344,"unpackedSize":9178235,"npm-signature":"-----BEGIN PGP SIGNATURE-----\r\nVersion: OpenPGP.js v4.10.10\r\nComment: https://openpgpjs.org\r\n\r\nwsFzBAEBCAAGBQJiMjqBACEJED1NWxICdlZqFiEECWMYAoorWMhJKdjhPU1b\r\nEgJ2VmoHKA//b/0Z0y4x/UWV2jRrnjLmRM5rJ6mXv3JYwBTD3PY8leUvwANZ\r\ne0T5WuVTJK3BPlwSfBcsOlZUvMy5EqvcmPADKlGN9bZPKF2UfotV2o8LRKzl\r\nCsm+LqEW/vY/dW/WTiBy/QXJ6VLTmcOhf+jOoCvlnt1tPlyTKW5dSuq0lnmh\r\nIy8mueotHBCyPYJVahI6s4KQLSe3ijBGf7IQOdNDVWOeCriOiqCNuf3D+0cx\r\ncpV4fxk+HuXQf/bzHW3dQQv7KO5WiG+yOJjQXSkJJ7dhiNqMrKqH+P8hukhR\r\n91TDi1uT7CbOwy5rUKEc35KDcjGmFaYrHEuz9HV77ZucMk56V/3z1XS+d3Lp\r\ne6Ag0gr1R1sosUdJA9p9s/HmUnMPSNkWfpHWjyLmLbIDL1rAHPs9MIBnkell\r\nXD48q0cptibo9iRu2pogO1kUGIZrdaqQwZ06RtGjgbfD97jd9fl7IpaJl6g5\r\nim/8n27jwmO6HmnWoWR4+xbZMCmOuDZ+IjwTJA5eDiOWKAfZCBd19Jh/APlA\r\nfqESn+68mmRQax7KLa970MjFgbSkogv9i2irnpX+rBQ/bpW4+7ymA2YJVX3+\r\nsjdk/weITls4Z4YYkpXJ7Og/V1BWCmWQURoxDGKcYtPyq6rfipNgduyZnaP0\r\nsdtl9QcXurD8LC1bIhWQ4Ysaq7SV1KAlEN4=\r\n=Uf5D\r\n-----END PGP SIGNATURE-----\r\n","signatures":[{"keyid":"SHA256:jl3bwswu80PjjokCgh0o2w5c2U4LhQAE57gj9cz1kzA","sig":"MEQCIEo950rKGnu8Lz43vtYGqA6tyqYGIGQt4eq0AEX6654OAiAoD6zxYMazNhnFaKgwuYNRviPL8Du/YJKFaNQKzWYhrA=="}]},"_npmUser":{"name":"abought","email":"abought@gmail.com"},"directories":{},"maintainers":[{"name":"frencil","email":"frencils@gmail.com"},{"name":"abought","email":"abought@gmail.com"},{"name":"welchr","email":"welchr@umich.edu"}],"_npmOperationalInternal":{"host":"s3://npm-registry-packages","tmp":"tmp/locuszoom_0.14.0_1647458945299_0.20719892881069146"},"_hasShrinkwrap":false}},"readme":"# LocusZoom\n\nLocusZoom is a Javascript/d3 embeddable plugin for interactively visualizing statistical genetic data from customizable sources.\n\n\nFor more information, see our paper:\n\n*Boughton, A. P. et al. LocusZoom.js: interactive and embeddable visualization of genetic association study results. Bioinformatics (2021) [doi:10.1093/bioinformatics/btab186](https://doi.org/10.1093/bioinformatics/btab186).*\n\n**This is a low level library aimed at developers who want to customize their own data sharing/visualization tools. If you are a genetics researcher who just wants to make a fast visualization of your research results, try our user-friendly plot-your-own data services built on LocusZoom.js: [my.locuszoom.org](https://my.locuszoom.org/) and [LocalZoom](https://statgen.github.io/localzoom/)**.\n\n\n\n\nSee [https://statgen.github.io/locuszoom/docs/](https://statgen.github.io/locuszoom/docs/) for full documentation and API reference.\n\nTo see functional examples of plots generated with LocusZoom.js see [statgen.github.io/locuszoom](http://statgen.github.io/locuszoom/) and [statgen.github.io/locuszoom/#examples](http://statgen.github.io/locuszoom/#examples).\n\n\n\n## Making a LocusZoom Plot: Quickstart tutorial\n\n### 1. Include Necessary JavaScript and CSS\n\nThe page you build that embeds the LocusZoom plugin must include the following resources, found in the `dist` directory (or preferably loaded via CDN):\n\n* `d3.js` \n [D3.js](https://d3js.org/) v5.16.0 is used to draw graphics in LocusZoom plots. It may be loaded [via a CDN](https://cdn.jsdelivr.net/npm/d3@^5.16.0). It must be present before LocusZoom is loaded.\n\n* `locuszoom.app.min.js` \n This is the primary application logic. It should only be included *after* the vendor dependencies have been included. \n\n* `locuszoom.css` \n This is the primary stylesheet. It is namespaced so as not to conflict with any other styles defined on the same page.\n\nInstead of copying the files to your project, **we recommend using CDN links are for these resources** (see [statgen.github.io/locuszoom/](http://statgen.github.io/locuszoom/)).\n\n*The above instructions describe using LocusZoom with pure JS and HTML. If you are using a module build system, LocusZoom supports usage via ES6 imports, eg:* \n\n```javascript\nimport LocusZoom from 'locuszoom';\nimport 'locuszoom/dist/locuszoom.css';\n```\n\n### 2. Define Data Sources\n\n**Data Sources** is an object representing a collection of arbitrarily many sources from which data for the plot can be requested. When adding sources to the collection they must be namespaced so that retrieving specific fields can be done with respect to specific data sources.\n\nHere's an example of defining a data sources object for a remote API:\n\n```javascript\nvar data_sources = new LocusZoom.DataSources();\ndata_sources.add(\"assoc\", [\"AssociationLZ\", { url: \"http://server.com/api/\", source: 1 }]);\n```\n\nThe above example adds an \"AssociationLZ\" data source (a predefined data source designed to make requests for association data) with a defined URL. The namespace for this data source is \"assoc\".\n\nData sources can also be local files:\n\n```javascript\ndata_sources = new LocusZoom.DataSources();\ndata_sources.add(\"assoc\", [\"AssociationLZ\", { url: \"file:///path/to/data.json\" }]);\n```\n\nRefer to the [Working with data guide](https://statgen.github.io/locuszoom/docs/guides/data_retrieval.html) for more information on using predefined data sources or extending/creating custom data sources.\n\n### 3. Define a Layout\n\n**Layout** is a serializable object that describes the configuration of the LocusZoom plot, including what data will be pulled from the data sources and displayed in what way, along with visual characteristics like color and geometry.\n\nA layout definition may look something like this (simplified example; consult docs for details):\n\n```javascript\nvar layout = {\n width: 500,\n height: 500,\n panels: [\n {\n id: \"association\",\n data_layers: [\n {\n id: \"association\",\n type: \"scatter\",\n x_axis: { field: \"assoc:position\" },\n y_axis: { field: \"assoc:pvalue\" }\n }\n ]\n }\n ]\n};\n```\n\nThe above example defines a basic plot that is 500 pixels on a side and has one panel with one scatter plot data layer that pulls in position and pvalue from the \"trait\" data source, mapping position to the x axis and pvalue to the y axis.\n\nThe LocusZoom.js library provides several pre-defined layouts for entire plots and subdivisions of plots such as panels, data layers, tool tips, etc. Refer to the [Layouts and visualization options guide](https://statgen.github.io/locuszoom/guides/rendering_layouts.html) for more information.\n\n### 4. Put it Together with `LocusZoom.populate()`\n\nWith includes included, data sources defined, and a layout defined, `LocusZoom.populate()` will accept a CSS selector string to populate the first matching element with a plot.\n\nA basic example may then look like this:\n\n```html\n\n \n \n \n \n \n \n \n \n\n```\n\n### Other Ways To Make a LocusZoom Plot\n\n#### Use a Predefined Layout\n\nThe core LocusZoom library comes equipped with several predefined layouts, organized by type (\"plot\", \"panel\", \"data_layer\", and \"toolbar\"). You can see what layouts are predefined by reading the [documentation](https://statgen.github.io/locuszoom/docs/api/module-LocusZoom_Layouts.html) or introspecting in the browser by entering `LocusZoom.Layouts.list()` (or to list one specific type, like \"data_layer\": `LocusZoom.Layouts.list(type)`).\n\nGet any predefined layout by type and name using `LocusZoom.Layouts.get(type, name)`.\n\nIf your data matches the field names and formats of the [UMich PortalDev API](https://portaldev.sph.umich.edu/docs/api/v1/#overview-of-api-endpoints), these layouts will provide a quick way to get started. If your data obeys different format rules, customization may be necessary. (for example, some LocusZoom features assume the presence of a field called `log_pvalue`)\n \nSee the [guide to working with layouts](https://statgen.github.io/locuszoom/docs/guides/rendering_layouts.html) for further details.\n\n#### Build a Layout Using Some Predefined Pieces\n\n`LocusZoom.Layouts.get(type, name)` can also be used to pull predefined layouts of smaller pieces, like data layers or \ntoolbars, into a custom layout:\n\n```javascript\nconst layout = {\n width: 1000,\n height: 500,\n panels: [\n LocusZoom.Layouts.get(\"panel\", \"association\"),\n {\n id: \"custom_panel\",\n ...options\n },\n LocusZoom.Layouts.get(\"panel\", \"genes\")\n ],\n ...\n};\n```\n\n#### Modify a Predefined Layout\n\nThe `get()` function also accepts a partial layout to be merged with the predefined layout as a third argument, providing the ability to use predefined layouts as starting points for custom layouts with only minor differences. Example:\n\n```javascript\nconst overrides = { label_font_size: 20 };\nLocusZoom.Layouts.get(\"data_layer\", \"genes\", overrides);\n```\n\n#### Predefining State by Building a State Object\n\n**State** is JSON-serializable object containing information that can affect the entire plot (including all data retrieval requests). State can be set before or after the plot is initialized. For example, the following special-named fields will cause the plot to be loaded to a specific region of interest on first render:\n\n```javascript\nconst layout = LocusZoom.Layouts.get('plot', 'standard_association', { state: { chr: 6, start: 20379709, end: 20979709 } })\n```\n\n#### Alternate: setting the initial view via `data-region`\n\nYou can also describe the locususing a `data-region` attribute of the containing element before populating it, like so:\n\n```html\n\n```\n\nWhen `LocusZoom.populate()` is executed on the element defined above it will automatically parse any `data-region` parameter to convert those values into the initial state.\n\n## Development Setup\n### Dependencies\n\nLocusZoom is an entirely client-side library designed to plug into arbitrary data sets, be they local files, APIs, or something else entirely. It has the following external dependencies:\n\n* [d3](http://d3js.org/) for data visualization\n\n### Build System and Automated Testing\n\nLocusZoom is bundled using Webpack. To install all necessary dependencies for a development environment, run:\n\n```bash\n$ npm install\n```\n\nWe recommend using node.js v12 or greater to build the library and run tests.\n\nOnce complete run `npm run build` from the top of the application directory to run all tests and build the LocusZoom library bundle.\n\nThis build process will also write sourcemaps, to help with debugging code even in production environments.\n\n#### Other supported build commands:\n\n* `npm run test` - Run unit tests (optional: `npm run test:coverage` to output a code coverage report)\n* `npm run dev` - Automatically rebuild the library whenever code changes (development mode)\n* `npm run build` - Run tests, and if they pass, build the library for release\n* `npm run css` - Rebuild the CSS using SASS (CSS rarely changes, so this doesn't get done automatically in dev mode)\n* `npm run docs` - Build just the library documentation\n\n\n#### Automated Testing\n\nLocusZoom uses [Mocha](https://mochajs.org/) for unit testing. Tests are located in the `test` subdirectory. Use `npm run test`.\n\n### Static analysis and code style\nLocusZoom runs code quality checks via [ESLint](http://eslint.org/), the rules for which can be found in `.eslintrc`. This will run automatically as part of all new code commits, and during every build. \n\n## Help and Support\n\nFull API documentation and prose guides are available at: [https://statgen.github.io/locuszoom/docs/](https://statgen.github.io/locuszoom/docs/)\n\nA LocusZoom discussion forum is available here: [https://groups.google.com/forum/#!forum/locuszoom](https://groups.google.com/forum/#!forum/locuszoom). \nFor the most effective help, please specify that your question is about \"LocusZoom.js\".\n\nIf you have questions or feedback please file an issue on the [LocusZoom.js GitHub repository](https://github.com/statgen/locuszoom/issues) or post at the discussion forum referenced above.\n","maintainers":[{"name":"frencil","email":"frencils@gmail.com"},{"name":"abought","email":"abought@gmail.com"},{"name":"welchr","email":"welchr@umich.edu"}],"time":{"modified":"2022-06-19T13:27:53.384Z","created":"2016-11-07T22:03:05.250Z","0.4.7":"2016-11-07T22:03:05.250Z","0.4.8":"2016-11-10T15:31:58.647Z","0.5.0":"2016-11-23T18:03:51.803Z","0.5.1":"2016-12-09T20:49:27.989Z","0.5.2":"2016-12-15T19:51:58.341Z","0.5.3":"2017-01-26T18:56:56.540Z","0.5.4":"2017-02-21T17:00:43.710Z","0.5.6":"2017-03-17T03:09:20.924Z","0.6.0":"2017-10-26T20:37:18.457Z","0.6.1":"2017-10-26T21:08:20.239Z","0.7.0":"2017-12-21T18:41:57.226Z","0.7.1":"2018-02-15T19:10:21.532Z","0.7.2":"2018-04-23T18:12:32.626Z","0.8.0":"2018-06-26T18:20:22.509Z","0.8.1":"2018-09-13T18:39:15.579Z","0.8.2":"2018-09-17T21:37:24.221Z","0.9.0":"2018-12-19T21:13:44.251Z","0.9.1":"2019-05-29T19:26:13.327Z","0.10.0-beta.1":"2019-10-07T18:52:41.710Z","0.10.0-beta.2":"2019-11-11T19:08:42.375Z","0.10.0":"2019-12-12T21:47:23.128Z","0.10.1":"2020-01-15T17:25:53.778Z","0.10.2":"2020-02-11T16:22:55.199Z","0.11.0-beta.1":"2020-06-04T20:18:35.263Z","0.11.0":"2020-07-10T21:30:11.100Z","0.12.0-beta.1":"2020-07-14T16:06:14.453Z","0.12.0-beta.2":"2020-07-28T20:34:20.436Z","0.12.0-beta.3":"2020-07-31T20:47:30.076Z","0.12.0-beta.4":"2020-08-06T18:53:08.690Z","0.12.0-beta.5":"2020-08-13T17:51:21.135Z","0.12.0":"2020-08-14T18:15:52.369Z","0.12.1":"2020-08-25T16:03:34.451Z","0.12.2":"2020-09-02T20:44:30.505Z","0.13.0-beta.1":"2020-10-15T15:36:15.443Z","0.13.0-beta.2":"2020-10-27T18:39:57.332Z","0.13.0-beta.3":"2020-12-11T17:04:16.440Z","0.13.0-beta.4":"2021-01-25T15:52:07.116Z","0.13.0":"2021-02-26T22:54:45.616Z","0.13.1":"2021-03-05T19:49:46.945Z","0.13.2":"2021-04-12T15:22:26.988Z","0.13.3":"2021-05-21T19:08:01.106Z","0.13.4":"2021-09-21T18:52:04.366Z","0.14.0-beta.1":"2021-11-11T18:16:46.491Z","0.14.0-beta.2":"2021-11-19T16:32:52.966Z","0.14.0-beta.3":"2022-01-28T04:47:55.611Z","0.14.0-beta.4":"2022-02-28T18:08:44.920Z","0.14.0":"2022-03-16T19:29:05.547Z"},"homepage":"https://github.com/statgen/locuszoom","keywords":["visualization","genetics","genes","gwas","phewas"],"repository":{"type":"git","url":"git+https://github.com/statgen/locuszoom.git"},"author":{"name":"University of Michigan Center for Statistical Genetics"},"bugs":{"url":"https://github.com/statgen/locuszoom/issues"},"license":"MIT","readmeFilename":"README.md","contributors":[{"name":"Christopher Clark"},{"name":"Matthew Flickinger"},{"name":"Ryan Welch"},{"name":"Peter VandeHaar"},{"name":"Andy Boughton","email":"abought@umich.edu"}]}