{"_id":"ztd-charts","_rev":"18-69d4b9a0085b500c4900ad4a40db69c1","name":"ztd-charts","dist-tags":{"latest":"0.12.0"},"versions":{"0.0.0-stage":{"name":"ztd-charts","version":"0.0.0-stage","_id":"ztd-charts@0.0.0-stage","stub":true,"maintainers":[{"name":"junhanleee","email":"junhanlee91@gmail.com"}],"dist":{"shasum":"fc1ea260dd3d64326e11bb9a805a8e518af85bbb","tarball":"https://registry.npmjs.org/ztd-charts/-/ztd-charts-0.0.0-stage.tgz","fileCount":2,"integrity":"sha512-jhBKhxxKK56axEMadFavwfI1su9pMCYBfJUyvi70lzqUtcqPq8iZPID5OSWq5FkrDmCKyaBBb1UeVVG5A8CiNw==","signatures":[{"sig":"MEYCIQCKE8yKKwxXuVG/UHpVO/TTZhQKKqGkpq2O4CI+urSnHwIhAJCTRzSz6JF6DRhkRJPfZU6TDc+WyxCXR4caORFQBjtR","keyid":"SHA256:DhQ8wR5APBvFHLF/+Tc+AYvPOdTpcIDqOhxsBHRwC7U"}],"unpackedSize":332},"_npmUser":{"name":"junhanleee","email":"junhanlee91@gmail.com"},"description":"Temporary package placeholder for staged publishing","directories":{}},"0.2.0":{"name":"ztd-charts","version":"0.2.0","keywords":["react","chart","svg","animation","dataviz","korean","mcp"],"author":{"name":"Junhan2"},"license":"MIT","_id":"ztd-charts@0.2.0","maintainers":[{"name":"junhanleee","email":"junhanlee91@gmail.com"}],"homepage":"https://charts.ztd.app/","bugs":{"url":"https://github.com/Junhan2/ztd-charts/issues"},"dist":{"shasum":"e37ff0127424c617fbfeacc80928f8b31bffdb41","tarball":"https://registry.npmjs.org/ztd-charts/-/ztd-charts-0.2.0.tgz","fileCount":62,"integrity":"sha512-hIVxu4czCq4HWty9a2PwzBFWZJwIf7j6smHRLHFSiZ8jJFR0V9m8n23K94JcV4b3z21nNNKxFGzxlGrUSwCl1Q==","signatures":[{"sig":"MEYCIQDprVOiu7fAFHzNLFQW+sHe1/DM/NtfblXofkpu1EkjogIhAIMNOHR83LjP7J3/TcB04wAC2mJZtZuV6IGb65POTW23","keyid":"SHA256:DhQ8wR5APBvFHLF/+Tc+AYvPOdTpcIDqOhxsBHRwC7U"},{"sig":"MEYCIQD0OxiLj53kkwwbf0sIYB0pqTFZaIcAXcP6JOsihXTvywIhALHcyc4M2Kw5njaYCafc2xPq+TsTeNFIp+156pTEihQn","keyid":"SHA256:DhQ8wR5APBvFHLF/+Tc+AYvPOdTpcIDqOhxsBHRwC7U"}],"unpackedSize":7986153},"main":"./dist/index.cjs","type":"module","_from":"file:ztd-charts-0.2.0.tgz","types":"./dist/index.d.ts","module":"./dist/index.js","exports":{".":{"import":{"types":"./dist/index.d.ts","default":"./dist/index.js"},"require":{"types":"./dist/index.d.cts","default":"./dist/index.cjs"}},"./spec":{"import":{"types":"./dist/spec.d.ts","default":"./dist/spec.js"},"require":{"types":"./dist/spec.d.cts","default":"./dist/spec.cjs"}},"./server":{"import":{"types":"./dist/server.d.ts","default":"./dist/server.js"},"require":{"types":"./dist/server.d.cts","default":"./dist/server.cjs"}},"./schema/*":"./schema/*","./schema.json":"./schema/chart-spec.schema.json","./package.json":"./package.json"},"scripts":{"dev":"tsup --watch","build":"rm -rf dist && tsup && node scripts/write-schema.mjs && node scripts/relative-sourcemaps.mjs","typecheck":"tsc --noEmit -p tsconfig.json"},"_npmUser":{"name":"junhanleee","email":"junhanlee91@gmail.com"},"_resolved":"/private/var/folders/5m/nm5g6t7x4zv9b539qkqmmvvr0000gn/T/72b3c66253792e76db09c1f0abb22aee/ztd-charts-0.2.0.tgz","_integrity":"sha512-hIVxu4czCq4HWty9a2PwzBFWZJwIf7j6smHRLHFSiZ8jJFR0V9m8n23K94JcV4b3z21nNNKxFGzxlGrUSwCl1Q==","repository":{"url":"git+https://github.com/Junhan2/ztd-charts.git","type":"git","directory":"packages/ztd-charts"},"_npmVersion":"11.9.0","description":"33 animated, interactive React charts in pure SVG with zero runtime dependencies, a JSON spec, and CLI and MCP tools for AI agents","directories":{},"sideEffects":false,"_nodeVersion":"24.14.0","_hasShrinkwrap":false,"devDependencies":{"tsup":"^9.0.0","react":"^19.3.1","react-dom":"^19.3.1","typescript":"5.9.3","@types/react":"^19.2.0","@types/react-dom":"^19.2.0"},"peerDependencies":{"react":">=18","react-dom":">=18"},"_npmOperationalInternal":{"tmp":"tmp/ztd-charts_0.2.0_1793855273093_0.315238456141938","host":"s3://npm-registry-packages-npm-production"}},"0.2.1":{"name":"ztd-charts","version":"0.2.1","keywords":["react","chart","svg","animation","dataviz","korean","mcp"],"author":{"name":"Junhan2"},"license":"MIT","_id":"ztd-charts@0.2.1","maintainers":[{"name":"junhanleee","email":"junhanlee91@gmail.com"}],"homepage":"https://charts.ztd.app/","bugs":{"url":"https://github.com/Junhan2/ztd-charts/issues"},"dist":{"shasum":"e63da524541a5e9188af3bdc87ef6b9cd3b79ad6","tarball":"https://registry.npmjs.org/ztd-charts/-/ztd-charts-0.2.1.tgz","fileCount":62,"integrity":"sha512-9hMN11Bi6cTdwxxbk1grq/CATeYZCfjNwyATSiM28VaYc4lVlwj3MsV8WUAhA9UPktQ4ji850fV+Lf06i9zj4Q==","signatures":[{"sig":"MEYCIQDqvoLrk5mg2Lc/k/4C+/Df74rUfmbmnifE0NaMCzq+NgIhAKUYWiddK/7D3HZVJcIMLzciNsvOiwaZgZU3Qcoo7TLd","keyid":"SHA256:DhQ8wR5APBvFHLF/+Tc+AYvPOdTpcIDqOhxsBHRwC7U"},{"sig":"MEUCIEyoPcQq4hZZg1HobmUj2Dy0d37s17GV3L+0WspMfnm5AiEAiw2/i1GSY2fybX8DhWyZd3ZGp9uhrtc41YBKzj1ySHg=","keyid":"SHA256:DhQ8wR5APBvFHLF/+Tc+AYvPOdTpcIDqOhxsBHRwC7U"}],"unpackedSize":8169439},"main":"./dist/index.cjs","type":"module","_from":"file:ztd-charts-0.2.1.tgz","types":"./dist/index.d.ts","module":"./dist/index.js","exports":{".":{"import":{"types":"./dist/index.d.ts","default":"./dist/index.js"},"require":{"types":"./dist/index.d.cts","default":"./dist/index.cjs"}},"./spec":{"import":{"types":"./dist/spec.d.ts","default":"./dist/spec.js"},"require":{"types":"./dist/spec.d.cts","default":"./dist/spec.cjs"}},"./server":{"import":{"types":"./dist/server.d.ts","default":"./dist/server.js"},"require":{"types":"./dist/server.d.cts","default":"./dist/server.cjs"}},"./schema/*":"./schema/*","./schema.json":"./schema/chart-spec.schema.json","./package.json":"./package.json"},"scripts":{"dev":"tsup --watch","build":"rm -rf dist && tsup && node scripts/write-schema.mjs && node scripts/relative-sourcemaps.mjs","typecheck":"tsc --noEmit -p tsconfig.json"},"_npmUser":{"name":"junhanleee","email":"junhanlee91@gmail.com"},"_resolved":"/private/var/folders/5m/nm5g6t7x4zv9b539qkqmmvvr0000gn/T/13cbdef325001ae30a5e5dd20f829613/ztd-charts-0.2.1.tgz","_integrity":"sha512-9hMN11Bi6cTdwxxbk1grq/CATeYZCfjNwyATSiM28VaYc4lVlwj3MsV8WUAhA9UPktQ4ji850fV+Lf06i9zj4Q==","repository":{"url":"git+https://github.com/Junhan2/ztd-charts.git","type":"git","directory":"packages/ztd-charts"},"_npmVersion":"11.9.0","description":"33 animated, interactive React charts in pure SVG with zero runtime dependencies, a JSON spec, and CLI and MCP tools for AI agents","directories":{},"sideEffects":false,"_nodeVersion":"24.14.0","_hasShrinkwrap":false,"devDependencies":{"tsup":"^9.0.0","react":"^19.3.1","react-dom":"^19.3.1","typescript":"5.9.3","@types/react":"^19.2.0","@types/react-dom":"^19.2.0"},"peerDependencies":{"react":">=18","react-dom":">=18"},"_npmOperationalInternal":{"tmp":"tmp/ztd-charts_0.2.1_1793887835036_0.5318328171367799","host":"s3://npm-registry-packages-npm-production"}},"0.3.0":{"name":"ztd-charts","version":"0.3.0","keywords":["react","chart","svg","animation","dataviz","korean","mcp"],"author":{"name":"Junhan2"},"license":"MIT","_id":"ztd-charts@0.3.0","maintainers":[{"name":"junhanleee","email":"junhanlee91@gmail.com"}],"homepage":"https://charts.ztd.app/","bugs":{"url":"https://github.com/Junhan2/ztd-charts/issues"},"dist":{"shasum":"dcc57abc6ef3c7a280c7d7b2428827befbb2fe56","tarball":"https://registry.npmjs.org/ztd-charts/-/ztd-charts-0.3.0.tgz","fileCount":62,"integrity":"sha512-Kc4oZT4pLg23oiK+hhBTXmO8pckLvOuIKQEBYeUtmOihSn8p6jSLF6y0wWRVTtRwQLD2ExlElqBlCfMZ4XXegQ==","signatures":[{"sig":"MEQCIC3L/dll5XKPqpGNlIEBkZ3fIUIcHqUV+OOVhxmonZ3TAiAt+X9u+LRfntqTf5bSFfdqf3J0qsg80qhLL1T02eUZPQ==","keyid":"SHA256:DhQ8wR5APBvFHLF/+Tc+AYvPOdTpcIDqOhxsBHRwC7U"},{"sig":"MEUCIQCm5VEqZcWzXbbSZUhruuB/rxqKMAgNHlPngRaXcb0Y+gIgE4vvLMMtki//QgJP3lpEphzDr45lVUHzt0hFyVRoXFc=","keyid":"SHA256:DhQ8wR5APBvFHLF/+Tc+AYvPOdTpcIDqOhxsBHRwC7U"}],"unpackedSize":8128288},"main":"./dist/index.cjs","type":"module","_from":"file:ztd-charts-0.3.0.tgz","types":"./dist/index.d.ts","module":"./dist/index.js","exports":{".":{"import":{"types":"./dist/index.d.ts","default":"./dist/index.js"},"require":{"types":"./dist/index.d.cts","default":"./dist/index.cjs"}},"./spec":{"import":{"types":"./dist/spec.d.ts","default":"./dist/spec.js"},"require":{"types":"./dist/spec.d.cts","default":"./dist/spec.cjs"}},"./server":{"import":{"types":"./dist/server.d.ts","default":"./dist/server.js"},"require":{"types":"./dist/server.d.cts","default":"./dist/server.cjs"}},"./schema/*":"./schema/*","./schema.json":"./schema/chart-spec.schema.json","./package.json":"./package.json"},"scripts":{"dev":"tsup --watch","build":"rm -rf dist && tsup && node scripts/write-schema.mjs && node scripts/relative-sourcemaps.mjs","typecheck":"tsc --noEmit -p tsconfig.json"},"_npmUser":{"name":"junhanleee","email":"junhanlee91@gmail.com"},"_resolved":"/private/var/folders/5m/nm5g6t7x4zv9b539qkqmmvvr0000gn/T/c99d35680499d684afc3682c56ba8405/ztd-charts-0.3.0.tgz","_integrity":"sha512-Kc4oZT4pLg23oiK+hhBTXmO8pckLvOuIKQEBYeUtmOihSn8p6jSLF6y0wWRVTtRwQLD2ExlElqBlCfMZ4XXegQ==","repository":{"url":"git+https://github.com/Junhan2/ztd-charts.git","type":"git","directory":"packages/ztd-charts"},"_npmVersion":"11.19.0","description":"33 animated, interactive React charts in pure SVG with zero runtime dependencies, a JSON spec, and CLI and MCP tools for AI agents","directories":{},"sideEffects":false,"_nodeVersion":"26.7.0","_hasShrinkwrap":false,"readmeFilename":"README.md","devDependencies":{"tsup":"^9.0.0","react":"^19.3.1","react-dom":"^19.3.1","typescript":"5.9.3","@types/react":"^19.2.0","@types/react-dom":"^19.2.0"},"peerDependencies":{"react":">=18","react-dom":">=18"},"_npmOperationalInternal":{"tmp":"tmp/ztd-charts_0.3.0_1794066301594_0.28870033804394823","host":"s3://npm-registry-packages-npm-production"}},"0.4.0":{"name":"ztd-charts","version":"0.4.0","keywords":["react","chart","svg","animation","dataviz","korean","mcp"],"author":{"name":"Junhan2"},"license":"MIT","_id":"ztd-charts@0.4.0","maintainers":[{"name":"junhanleee","email":"junhanlee91@gmail.com"}],"homepage":"https://charts.ztd.app/","bugs":{"url":"https://github.com/Junhan2/ztd-charts/issues"},"dist":{"shasum":"dcabbba1b04ab4306c2993c272145d46d46d7f53","tarball":"https://registry.npmjs.org/ztd-charts/-/ztd-charts-0.4.0.tgz","fileCount":62,"integrity":"sha512-1gXTEq/z0hW7JtkRJ8K1y9Sz6J4t+3hkywFPklnPF6zRxMWL0yHqfCeIpFIBRNbTZ5q7YPaYzd0W4Xzi45YvQw==","signatures":[{"sig":"MEYCIQCEkfmttIz+Mw2RI62QPfC8oDE2p3BInL4Sd1pEmYqImgIhAOcWmrPRe7xqZEEBkveSK5ixfGB9QWVzenJAWp49jkW9","keyid":"SHA256:DhQ8wR5APBvFHLF/+Tc+AYvPOdTpcIDqOhxsBHRwC7U"},{"sig":"MEUCIQCBdC29hgX23ZoM8boZSnabre+oi478ctT0UmxXEgyo+wIgDiG8qx1KUQUwD2wK53Mg1XKstAx6PqjmuXbAqZCg0nY=","keyid":"SHA256:DhQ8wR5APBvFHLF/+Tc+AYvPOdTpcIDqOhxsBHRwC7U"}],"unpackedSize":8678620},"main":"./dist/index.cjs","type":"module","_from":"file:ztd-charts-0.4.0.tgz","types":"./dist/index.d.ts","module":"./dist/index.js","exports":{".":{"import":{"types":"./dist/index.d.ts","default":"./dist/index.js"},"require":{"types":"./dist/index.d.cts","default":"./dist/index.cjs"}},"./spec":{"import":{"types":"./dist/spec.d.ts","default":"./dist/spec.js"},"require":{"types":"./dist/spec.d.cts","default":"./dist/spec.cjs"}},"./server":{"import":{"types":"./dist/server.d.ts","default":"./dist/server.js"},"require":{"types":"./dist/server.d.cts","default":"./dist/server.cjs"}},"./schema/*":"./schema/*","./schema.json":"./schema/chart-spec.schema.json","./package.json":"./package.json"},"scripts":{"dev":"tsup --watch","build":"rm -rf dist && tsup && node scripts/write-schema.mjs && node scripts/relative-sourcemaps.mjs","typecheck":"tsc --noEmit -p tsconfig.json"},"_npmUser":{"name":"junhanleee","email":"junhanlee91@gmail.com"},"_resolved":"/private/var/folders/5m/nm5g6t7x4zv9b539qkqmmvvr0000gn/T/6cdd1ecd99b09c89e15fcb1c1e359bd7/ztd-charts-0.4.0.tgz","_integrity":"sha512-1gXTEq/z0hW7JtkRJ8K1y9Sz6J4t+3hkywFPklnPF6zRxMWL0yHqfCeIpFIBRNbTZ5q7YPaYzd0W4Xzi45YvQw==","repository":{"url":"git+https://github.com/Junhan2/ztd-charts.git","type":"git","directory":"packages/ztd-charts"},"_npmVersion":"11.19.0","description":"33 animated, interactive React charts in pure SVG with zero runtime dependencies, a JSON spec, and CLI and MCP tools for AI agents","directories":{},"sideEffects":false,"_nodeVersion":"26.7.0","_hasShrinkwrap":false,"devDependencies":{"tsup":"^9.0.0","react":"^19.3.1","react-dom":"^19.3.1","typescript":"5.9.3","@types/react":"^19.2.0","@types/react-dom":"^19.2.0"},"peerDependencies":{"react":">=18","react-dom":">=18"},"_npmOperationalInternal":{"tmp":"tmp/ztd-charts_0.4.0_1794066380845_0.40762526923599074","host":"s3://npm-registry-packages-npm-production"}},"0.4.1":{"name":"ztd-charts","version":"0.4.1","keywords":["react","chart","svg","animation","dataviz","korean","mcp"],"author":{"name":"Junhan2"},"license":"MIT","_id":"ztd-charts@0.4.1","maintainers":[{"name":"junhanleee","email":"junhanlee91@gmail.com"}],"homepage":"https://charts.ztd.app/","bugs":{"url":"https://github.com/Junhan2/ztd-charts/issues"},"dist":{"shasum":"7fc961beebd0683bfe592669b4e203c3edf7e98b","tarball":"https://registry.npmjs.org/ztd-charts/-/ztd-charts-0.4.1.tgz","fileCount":54,"integrity":"sha512-tfPsWBzlo29mOrOCvNBviS2h84emw0BdT7cK3H4W1dw+UqcVlCtZLCxDO6fC7AzrrpS+44GDv5fO6el6S+tKTA==","signatures":[{"sig":"MEQCIEVTzOVV7TOeXf0Xj4YsBvzEELVoMiLDEWPiQh69wqG5AiAUHwu4k7NA0hC41pcJDlKkYVRe/MzwPg/9ikFR4i/ohQ==","keyid":"SHA256:DhQ8wR5APBvFHLF/+Tc+AYvPOdTpcIDqOhxsBHRwC7U"},{"sig":"MEYCIQCSxYwgaQFTTelHb7/vY1s/OFt6HIoKRltJE4NaE2BqxAIhAMC85a/GHu/+YtZnuBUXN+D9JRFTbLBd/wl9SM7jfqT6","keyid":"SHA256:DhQ8wR5APBvFHLF/+Tc+AYvPOdTpcIDqOhxsBHRwC7U"}],"unpackedSize":3408788},"main":"./dist/index.cjs","type":"module","_from":"file:ztd-charts-0.4.1.tgz","types":"./dist/index.d.ts","module":"./dist/index.js","exports":{".":{"import":{"types":"./dist/index.d.ts","default":"./dist/index.js"},"require":{"types":"./dist/index.d.cts","default":"./dist/index.cjs"}},"./spec":{"import":{"types":"./dist/spec.d.ts","default":"./dist/spec.js"},"require":{"types":"./dist/spec.d.cts","default":"./dist/spec.cjs"}},"./server":{"import":{"types":"./dist/server.d.ts","default":"./dist/server.js"},"require":{"types":"./dist/server.d.cts","default":"./dist/server.cjs"}},"./schema/*":"./schema/*","./schema.json":"./schema/chart-spec.schema.json","./package.json":"./package.json"},"scripts":{"dev":"tsup --watch","build":"rm -rf dist && tsup && node scripts/write-schema.mjs","typecheck":"tsc --noEmit -p tsconfig.json"},"_npmUser":{"name":"junhanleee","email":"junhanlee91@gmail.com"},"_resolved":"/private/var/folders/5m/nm5g6t7x4zv9b539qkqmmvvr0000gn/T/74c6aa050fce9e2470af20cb0ac0eefd/ztd-charts-0.4.1.tgz","_integrity":"sha512-tfPsWBzlo29mOrOCvNBviS2h84emw0BdT7cK3H4W1dw+UqcVlCtZLCxDO6fC7AzrrpS+44GDv5fO6el6S+tKTA==","repository":{"url":"git+https://github.com/Junhan2/ztd-charts.git","type":"git","directory":"packages/ztd-charts"},"_npmVersion":"11.19.0","description":"33 animated, interactive React charts in pure SVG with zero runtime dependencies, a JSON spec, and CLI and MCP tools for AI agents","directories":{},"sideEffects":false,"_nodeVersion":"26.7.0","_hasShrinkwrap":false,"devDependencies":{"tsup":"^9.0.0","react":"^19.3.1","react-dom":"^19.3.1","typescript":"5.9.3","@types/react":"^19.2.0","@types/react-dom":"^19.2.0"},"peerDependencies":{"react":">=18","react-dom":">=18"},"_npmOperationalInternal":{"tmp":"tmp/ztd-charts_0.4.1_1794128974990_0.6521141142970899","host":"s3://npm-registry-packages-npm-production"}},"0.5.0":{"name":"ztd-charts","version":"0.5.0","keywords":["react","chart","svg","animation","dataviz","korean","mcp"],"author":{"name":"Junhan2"},"license":"MIT","_id":"ztd-charts@0.5.0","maintainers":[{"name":"junhanleee","email":"junhanlee91@gmail.com"}],"homepage":"https://charts.ztd.app/","bugs":{"url":"https://github.com/Junhan2/ztd-charts/issues"},"dist":{"shasum":"143c0800ee7b01b3d6181bc9d38a19414a5e84a4","tarball":"https://registry.npmjs.org/ztd-charts/-/ztd-charts-0.5.0.tgz","fileCount":57,"integrity":"sha512-ttIsC3pMDc+Lo0aX7U5hWwqXwu4uwP0xe69h2OlA38R8CdPYgksisx1VEGGdyge8NGxd/eXB0i/JL+Qvf+U/1Q==","signatures":[{"sig":"MEUCIFBfkyYVwVKVrMkFAFpgKwzsssnX00tIxe3bNfOJ4D/SAiEA/I3xdHvWrErAvSKG4y1+SP7nIwPyb+7H/pEarkdwKCA=","keyid":"SHA256:DhQ8wR5APBvFHLF/+Tc+AYvPOdTpcIDqOhxsBHRwC7U"},{"sig":"MEUCICjDALyFL7SL8WCq4RiJcRP5IaLdrG1Dd8B1VSi/ZGJWAiEAw0HnprrPkaeu6BvXS6n15x9dvglvcHhZcPGWiyFhAFs=","keyid":"SHA256:DhQ8wR5APBvFHLF/+Tc+AYvPOdTpcIDqOhxsBHRwC7U"}],"unpackedSize":4037650},"main":"./dist/index.cjs","type":"module","_from":"file:ztd-charts-0.5.0.tgz","types":"./dist/index.d.ts","module":"./dist/index.js","exports":{".":{"import":{"types":"./dist/index.d.ts","default":"./dist/index.js"},"require":{"types":"./dist/index.d.cts","default":"./dist/index.cjs"}},"./spec":{"import":{"types":"./dist/spec.d.ts","default":"./dist/spec.js"},"require":{"types":"./dist/spec.d.cts","default":"./dist/spec.cjs"}},"./server":{"import":{"types":"./dist/server.d.ts","default":"./dist/server.js"},"require":{"types":"./dist/server.d.cts","default":"./dist/server.cjs"}},"./schema/*":"./schema/*","./schema.json":"./schema/chart-spec.schema.json","./package.json":"./package.json"},"scripts":{"dev":"tsup --watch","build":"rm -rf dist && tsup && node scripts/write-schema.mjs","typecheck":"tsc --noEmit -p tsconfig.json"},"_npmUser":{"name":"junhanleee","email":"junhanlee91@gmail.com"},"_resolved":"/private/var/folders/5m/nm5g6t7x4zv9b539qkqmmvvr0000gn/T/797093da288d19d659352db234b5a6df/ztd-charts-0.5.0.tgz","_integrity":"sha512-ttIsC3pMDc+Lo0aX7U5hWwqXwu4uwP0xe69h2OlA38R8CdPYgksisx1VEGGdyge8NGxd/eXB0i/JL+Qvf+U/1Q==","repository":{"url":"git+https://github.com/Junhan2/ztd-charts.git","type":"git","directory":"packages/ztd-charts"},"_npmVersion":"11.19.0","description":"36 animated, interactive React charts in pure SVG with zero runtime dependencies, a JSON spec, and CLI and MCP tools for AI agents","directories":{},"sideEffects":false,"_nodeVersion":"26.7.0","_hasShrinkwrap":false,"devDependencies":{"tsup":"^9.0.0","react":"^19.3.1","react-dom":"^19.3.1","typescript":"5.9.3","@types/react":"^19.2.0","@types/react-dom":"^19.2.0"},"peerDependencies":{"react":">=18","react-dom":">=18"},"_npmOperationalInternal":{"tmp":"tmp/ztd-charts_0.5.0_1794198271257_0.37832397153481256","host":"s3://npm-registry-packages-npm-production"}},"0.5.1":{"name":"ztd-charts","version":"0.5.1","keywords":["react","chart","svg","animation","dataviz","korean","mcp"],"author":{"name":"Junhan2"},"license":"MIT","_id":"ztd-charts@0.5.1","maintainers":[{"name":"junhanleee","email":"junhanlee91@gmail.com"}],"homepage":"https://charts.ztd.app/","bugs":{"url":"https://github.com/Junhan2/ztd-charts/issues"},"dist":{"shasum":"ff16e36fcbfc1a6971b5616841c403781f6a1cdf","tarball":"https://registry.npmjs.org/ztd-charts/-/ztd-charts-0.5.1.tgz","fileCount":57,"integrity":"sha512-xb7YpshB36wdJugDtL8A+xQGQpkIA0d1woyZ4yUuMXPQDfTGc6UdXI30gPnPc79+0+LndACVrRQSk4nyZLv/Uw==","signatures":[{"sig":"MEQCIDWEq+YcYBiOIc9nnoVf3fN4jNyDkBcjMiFTprCsmAmPAiAsuLxWa9AbmQ8CRFKOfTZOJDZeHAzJW9YfGfnLDB9P6w==","keyid":"SHA256:DhQ8wR5APBvFHLF/+Tc+AYvPOdTpcIDqOhxsBHRwC7U"},{"sig":"MEYCIQCdbZuBhiKOBdu63XAjoLEfWNWUh7VgEOwUFgDyk86EIgIhAIwzWHl7Fv+u80aIB5B9cZyoZU/HaI1bmVpNsfN/+bjA","keyid":"SHA256:DhQ8wR5APBvFHLF/+Tc+AYvPOdTpcIDqOhxsBHRwC7U"}],"unpackedSize":4118986},"main":"./dist/index.cjs","type":"module","_from":"file:ztd-charts-0.5.1.tgz","types":"./dist/index.d.ts","module":"./dist/index.js","exports":{".":{"import":{"types":"./dist/index.d.ts","default":"./dist/index.js"},"require":{"types":"./dist/index.d.cts","default":"./dist/index.cjs"}},"./spec":{"import":{"types":"./dist/spec.d.ts","default":"./dist/spec.js"},"require":{"types":"./dist/spec.d.cts","default":"./dist/spec.cjs"}},"./server":{"import":{"types":"./dist/server.d.ts","default":"./dist/server.js"},"require":{"types":"./dist/server.d.cts","default":"./dist/server.cjs"}},"./schema/*":"./schema/*","./schema.json":"./schema/chart-spec.schema.json","./package.json":"./package.json"},"scripts":{"dev":"tsup --watch","build":"rm -rf dist && tsup && node scripts/write-schema.mjs","typecheck":"tsc --noEmit -p tsconfig.json"},"_npmUser":{"name":"junhanleee","email":"junhanlee91@gmail.com"},"_resolved":"/private/var/folders/5m/nm5g6t7x4zv9b539qkqmmvvr0000gn/T/464c053e94643de053b136b069d10913/ztd-charts-0.5.1.tgz","_integrity":"sha512-xb7YpshB36wdJugDtL8A+xQGQpkIA0d1woyZ4yUuMXPQDfTGc6UdXI30gPnPc79+0+LndACVrRQSk4nyZLv/Uw==","repository":{"url":"git+https://github.com/Junhan2/ztd-charts.git","type":"git","directory":"packages/ztd-charts"},"_npmVersion":"11.9.0","description":"36 animated, interactive React charts in pure SVG with zero runtime dependencies, a JSON spec, and CLI and MCP tools for AI agents","directories":{},"sideEffects":false,"_nodeVersion":"24.14.0","_hasShrinkwrap":false,"devDependencies":{"tsup":"^9.0.0","react":"^19.3.1","react-dom":"^19.3.1","typescript":"5.9.3","@types/react":"^19.2.0","@types/react-dom":"^19.2.0"},"peerDependencies":{"react":">=18","react-dom":">=18"},"_npmOperationalInternal":{"tmp":"tmp/ztd-charts_0.5.1_1794240832765_0.17493226249725846","host":"s3://npm-registry-packages-npm-production"}},"0.6.0":{"name":"ztd-charts","version":"0.6.0","keywords":["react","chart","svg","animation","dataviz","korean","mcp"],"author":{"name":"Junhan2"},"license":"MIT","_id":"ztd-charts@0.6.0","maintainers":[{"name":"junhanleee","email":"junhanlee91@gmail.com"}],"homepage":"https://charts.ztd.app/","bugs":{"url":"https://github.com/Junhan2/ztd-charts/issues"},"dist":{"shasum":"1f8e17b304d1bafde585c2d3420f9a20c915353d","tarball":"https://registry.npmjs.org/ztd-charts/-/ztd-charts-0.6.0.tgz","fileCount":57,"integrity":"sha512-xI6WWtYib6G/0poV7HIBPX8XvRue1z97CJxohRKf1hDKQnm0lWukEJxx7NTEIY1fVUAIELUH7Vtl8GC9JJYuKw==","signatures":[{"sig":"MEQCIHnqBr2l4Qu+ZYGlSOKUmGMxqAhqbmVAMuB9hdyQVt6PAiBuKb0rGmBIYKTacbS5THL+/kdoW+pr0EugsZ6jLzx0Cw==","keyid":"SHA256:DhQ8wR5APBvFHLF/+Tc+AYvPOdTpcIDqOhxsBHRwC7U"},{"sig":"MEUCIQDXL0zmgZeWCIX3U8hWGKGJLdk3lMN0PsQUNCR9DZSIuAIgM4oWiGu5i+/gBuBzVlerEQ1VJNghYfCQqTGfxELrt+4=","keyid":"SHA256:DhQ8wR5APBvFHLF/+Tc+AYvPOdTpcIDqOhxsBHRwC7U"}],"unpackedSize":4424164},"main":"./dist/index.cjs","type":"module","_from":"file:ztd-charts-0.6.0.tgz","types":"./dist/index.d.ts","module":"./dist/index.js","exports":{".":{"import":{"types":"./dist/index.d.ts","default":"./dist/index.js"},"require":{"types":"./dist/index.d.cts","default":"./dist/index.cjs"}},"./spec":{"import":{"types":"./dist/spec.d.ts","default":"./dist/spec.js"},"require":{"types":"./dist/spec.d.cts","default":"./dist/spec.cjs"}},"./server":{"import":{"types":"./dist/server.d.ts","default":"./dist/server.js"},"require":{"types":"./dist/server.d.cts","default":"./dist/server.cjs"}},"./schema/*":"./schema/*","./schema.json":"./schema/chart-spec.schema.json","./package.json":"./package.json"},"scripts":{"dev":"tsup --watch","build":"rm -rf dist && tsup && node scripts/write-schema.mjs","typecheck":"tsc --noEmit -p tsconfig.json"},"_npmUser":{"name":"junhanleee","email":"junhanlee91@gmail.com"},"_resolved":"/private/var/folders/5m/nm5g6t7x4zv9b539qkqmmvvr0000gn/T/a0264a4b163bb6d36251620d2a6c96ca/ztd-charts-0.6.0.tgz","_integrity":"sha512-xI6WWtYib6G/0poV7HIBPX8XvRue1z97CJxohRKf1hDKQnm0lWukEJxx7NTEIY1fVUAIELUH7Vtl8GC9JJYuKw==","repository":{"url":"git+https://github.com/Junhan2/ztd-charts.git","type":"git","directory":"packages/ztd-charts"},"_npmVersion":"11.19.0","description":"36 animated, interactive React charts in pure SVG with zero runtime dependencies, a JSON spec, and CLI and MCP tools for AI agents","directories":{},"sideEffects":false,"_nodeVersion":"26.7.0","_hasShrinkwrap":false,"devDependencies":{"tsup":"^9.0.0","react":"^19.3.1","react-dom":"^19.3.1","typescript":"5.9.3","@types/react":"^19.2.0","@types/react-dom":"^19.2.0"},"peerDependencies":{"react":">=18","react-dom":">=18"},"_npmOperationalInternal":{"tmp":"tmp/ztd-charts_0.6.0_1794270680746_0.3392815217876859","host":"s3://npm-registry-packages-npm-production"}},"0.7.0":{"name":"ztd-charts","version":"0.7.0","keywords":["react","chart","svg","animation","dataviz","korean","mcp"],"author":{"name":"Junhan2"},"license":"MIT","_id":"ztd-charts@0.7.0","maintainers":[{"name":"junhanleee","email":"junhanlee91@gmail.com"}],"homepage":"https://charts.ztd.app/","bugs":{"url":"https://github.com/Junhan2/ztd-charts/issues"},"dist":{"shasum":"b02ae356164942e5eddaf1e730478aa31758ea72","tarball":"https://registry.npmjs.org/ztd-charts/-/ztd-charts-0.7.0.tgz","fileCount":58,"integrity":"sha512-ieL2oYAvkfFO/i2JTxGAoYHaIJyUpt94js8o4kPQ3ZEjzWd75L5gMb8vFsfK+Izz5Yjr9lZLSRM3zJpx5NUmIQ==","signatures":[{"sig":"MEYCIQCxzeuXQqbGkglQ8C6uewXUwdwmjLCpk6VoZPbvcIT5WQIhALNWtl/p1cT5QDEYht24B0w/MR+nBFtcz1x0oTz6TAg6","keyid":"SHA256:DhQ8wR5APBvFHLF/+Tc+AYvPOdTpcIDqOhxsBHRwC7U"},{"sig":"MEQCIGKDboeKwZS4/1Q798Et5dxyc/nzPwDHOku0V338AeAmAiA/I+2SPiJmtcg3oZWmJG8KnNLgLb28qdj7Hnl5lTAWsg==","keyid":"SHA256:DhQ8wR5APBvFHLF/+Tc+AYvPOdTpcIDqOhxsBHRwC7U"}],"attestations":{"url":"https://registry.npmjs.org/-/npm/v1/attestations/ztd-charts@0.7.0","provenance":{"predicateType":"https://slsa.dev/provenance/v1"}},"unpackedSize":4777919},"main":"./dist/index.cjs","type":"module","_from":"file:ztd-charts-0.7.0.tgz","types":"./dist/index.d.ts","module":"./dist/index.js","exports":{".":{"import":{"types":"./dist/index.d.ts","default":"./dist/index.js"},"require":{"types":"./dist/index.d.cts","default":"./dist/index.cjs"}},"./spec":{"import":{"types":"./dist/spec.d.ts","default":"./dist/spec.js"},"require":{"types":"./dist/spec.d.cts","default":"./dist/spec.cjs"}},"./server":{"import":{"types":"./dist/server.d.ts","default":"./dist/server.js"},"require":{"types":"./dist/server.d.cts","default":"./dist/server.cjs"}},"./schema/*":"./schema/*","./schema.json":"./schema/chart-spec.schema.json","./package.json":"./package.json"},"scripts":{"dev":"tsup --watch","build":"rm -rf dist && tsup && node scripts/write-schema.mjs","typecheck":"tsc --noEmit -p tsconfig.json"},"_npmUser":{"name":"GitHub Actions","email":"npm-oidc-no-reply@github.com","trustedPublisher":{"id":"github","oidcConfigId":"37b15df9-644c-4f49-a568-91f91e14f812"}},"_resolved":"/home/runner/work/ztd-charts/ztd-charts/ztd-charts-0.7.0.tgz","_integrity":"sha512-ieL2oYAvkfFO/i2JTxGAoYHaIJyUpt94js8o4kPQ3ZEjzWd75L5gMb8vFsfK+Izz5Yjr9lZLSRM3zJpx5NUmIQ==","repository":{"url":"git+https://github.com/Junhan2/ztd-charts.git","type":"git","directory":"packages/ztd-charts"},"_npmVersion":"11.19.1","description":"37 animated, interactive React charts in pure SVG with zero runtime dependencies, a JSON spec, and CLI and MCP tools for AI agents","directories":{},"sideEffects":false,"_nodeVersion":"24.22.2","_hasShrinkwrap":false,"devDependencies":{"tsup":"^9.0.0","react":"^19.3.1","react-dom":"^19.3.1","typescript":"5.9.3","@types/react":"^19.2.0","@types/react-dom":"^19.2.0"},"peerDependencies":{"react":">=18","react-dom":">=18"},"_npmOperationalInternal":{"tmp":"tmp/ztd-charts_0.7.0_1794317586462_0.4388588328275076","host":"s3://npm-registry-packages-npm-production"}},"0.8.0":{"name":"ztd-charts","version":"0.8.0","keywords":["react","chart","svg","animation","dataviz","korean","mcp"],"author":{"name":"Junhan2"},"license":"MIT","_id":"ztd-charts@0.8.0","maintainers":[{"name":"junhanleee","email":"junhanlee91@gmail.com"}],"homepage":"https://charts.ztd.app/","bugs":{"url":"https://github.com/Junhan2/ztd-charts/issues"},"dist":{"shasum":"0e17c6082b9577fd5e478657856625c0935cdf7b","tarball":"https://registry.npmjs.org/ztd-charts/-/ztd-charts-0.8.0.tgz","fileCount":80,"integrity":"sha512-47tTvztbyQrjkCIJYtZlPoloK1SK/Ccoq1X8Ndr3egh44m5sqxLy9tOwBD+OeLFcjMF5tzSNkGWQ25iGi7Q8/g==","signatures":[{"sig":"MEUCIQDjEw6mfhnvbLn5JO7+qtnKa6suIAp5YRf92Br16h3vJwIgGr1mjCTdRESRvBl3QRnfh0TN1X12duIvx0gzvjrTYxw=","keyid":"SHA256:DhQ8wR5APBvFHLF/+Tc+AYvPOdTpcIDqOhxsBHRwC7U"},{"sig":"MEUCIQDqeoqT0qRc8rbC100PfM86z9HFfOhYgSFNgX+OJzyFGwIgKu3jFEu6ZllpqYg2l6SNvzysrEnmAFgCHEYirox9SQM=","keyid":"SHA256:DhQ8wR5APBvFHLF/+Tc+AYvPOdTpcIDqOhxsBHRwC7U"}],"attestations":{"url":"https://registry.npmjs.org/-/npm/v1/attestations/ztd-charts@0.8.0","provenance":{"predicateType":"https://slsa.dev/provenance/v1"}},"unpackedSize":6904416},"main":"./dist/index.cjs","type":"module","_from":"file:ztd-charts-0.8.0.tgz","types":"./dist/index.d.ts","module":"./dist/index.js","exports":{".":{"import":{"types":"./dist/index.d.ts","default":"./dist/index.js"},"require":{"types":"./dist/index.d.cts","default":"./dist/index.cjs"}},"./spec":{"import":{"types":"./dist/spec.d.ts","default":"./dist/spec.js"},"require":{"types":"./dist/spec.d.cts","default":"./dist/spec.cjs"}},"./server":{"import":{"types":"./dist/server.d.ts","default":"./dist/server.js"},"require":{"types":"./dist/server.d.cts","default":"./dist/server.cjs"}},"./schema/*":"./schema/*","./geo/world":{"import":{"types":"./dist/geo/world.d.ts","default":"./dist/geo/world.js"},"require":{"types":"./dist/geo/world.d.cts","default":"./dist/geo/world.cjs"}},"./geo/kr-sido":{"import":{"types":"./dist/geo/kr-sido.d.ts","default":"./dist/geo/kr-sido.js"},"require":{"types":"./dist/geo/kr-sido.d.cts","default":"./dist/geo/kr-sido.cjs"}},"./schema.json":"./schema/chart-spec.schema.json","./package.json":"./package.json","./geo/us-states":{"import":{"types":"./dist/geo/us-states.d.ts","default":"./dist/geo/us-states.js"},"require":{"types":"./dist/geo/us-states.d.cts","default":"./dist/geo/us-states.cjs"}}},"scripts":{"dev":"tsup --watch","build":"rm -rf dist && tsup && node scripts/write-schema.mjs","typecheck":"tsc --noEmit -p tsconfig.json"},"_npmUser":{"name":"GitHub Actions","email":"npm-oidc-no-reply@github.com","trustedPublisher":{"id":"github","oidcConfigId":"37b15df9-644c-4f49-a568-91f91e14f812"}},"_resolved":"/home/runner/work/ztd-charts/ztd-charts/ztd-charts-0.8.0.tgz","_integrity":"sha512-47tTvztbyQrjkCIJYtZlPoloK1SK/Ccoq1X8Ndr3egh44m5sqxLy9tOwBD+OeLFcjMF5tzSNkGWQ25iGi7Q8/g==","repository":{"url":"git+https://github.com/Junhan2/ztd-charts.git","type":"git","directory":"packages/ztd-charts"},"_npmVersion":"11.19.1","description":"44 animated, interactive React charts in pure SVG with zero runtime dependencies, a JSON spec, and CLI and MCP tools for AI agents","directories":{},"sideEffects":false,"_nodeVersion":"24.22.2","_hasShrinkwrap":false,"devDependencies":{"tsup":"^9.0.0","react":"^19.3.1","react-dom":"^19.3.1","typescript":"5.9.3","@types/react":"^19.2.0","@types/react-dom":"^19.2.0"},"peerDependencies":{"react":">=18","react-dom":">=18"},"_npmOperationalInternal":{"tmp":"tmp/ztd-charts_0.8.0_1794365312357_0.6335410797695734","host":"s3://npm-registry-packages-npm-production"}},"0.9.0":{"name":"ztd-charts","version":"0.9.0","keywords":["react","chart","svg","animation","dataviz","korean","mcp"],"author":{"name":"Junhan2"},"license":"MIT","_id":"ztd-charts@0.9.0","maintainers":[{"name":"junhanleee","email":"junhanlee91@gmail.com"}],"homepage":"https://charts.ztd.app/","bugs":{"url":"https://github.com/Junhan2/ztd-charts/issues"},"dist":{"shasum":"1501b38d6a9fb6b0af03c47bad69ec635a95ea3e","tarball":"https://registry.npmjs.org/ztd-charts/-/ztd-charts-0.9.0.tgz","fileCount":80,"integrity":"sha512-C4rKNJoRR/z6IcbCBBG0ADfKmVhCrCOu/JIZKtHuxnoCYiFg4yi/rPqT/GBeSQmdE9nKoVYJyk8tSlXO+Bv25w==","signatures":[{"sig":"MEYCIQCghRdaokIuwk8rAQo/+wy/2PeVYBXrHRc4oV3iK04yxwIhAOcSDQDpvH7wyiK2pDy944l4+XYH8fZEiLTgJheCa/cM","keyid":"SHA256:DhQ8wR5APBvFHLF/+Tc+AYvPOdTpcIDqOhxsBHRwC7U"},{"sig":"MEYCIQDr6lLB6wvBjWrqTj+8/hZUZWJDhR81F/6/JpMM8b79FQIhAM8yBeCN1GWkjOX4gvUrHiyNKDlNCoBHn+w9uwxB2qAa","keyid":"SHA256:DhQ8wR5APBvFHLF/+Tc+AYvPOdTpcIDqOhxsBHRwC7U"}],"attestations":{"url":"https://registry.npmjs.org/-/npm/v1/attestations/ztd-charts@0.9.0","provenance":{"predicateType":"https://slsa.dev/provenance/v1"}},"unpackedSize":6918725},"main":"./dist/index.cjs","type":"module","_from":"file:ztd-charts-0.9.0.tgz","types":"./dist/index.d.ts","module":"./dist/index.js","exports":{".":{"import":{"types":"./dist/index.d.ts","default":"./dist/index.js"},"require":{"types":"./dist/index.d.cts","default":"./dist/index.cjs"}},"./spec":{"import":{"types":"./dist/spec.d.ts","default":"./dist/spec.js"},"require":{"types":"./dist/spec.d.cts","default":"./dist/spec.cjs"}},"./server":{"import":{"types":"./dist/server.d.ts","default":"./dist/server.js"},"require":{"types":"./dist/server.d.cts","default":"./dist/server.cjs"}},"./schema/*":"./schema/*","./geo/world":{"import":{"types":"./dist/geo/world.d.ts","default":"./dist/geo/world.js"},"require":{"types":"./dist/geo/world.d.cts","default":"./dist/geo/world.cjs"}},"./geo/kr-sido":{"import":{"types":"./dist/geo/kr-sido.d.ts","default":"./dist/geo/kr-sido.js"},"require":{"types":"./dist/geo/kr-sido.d.cts","default":"./dist/geo/kr-sido.cjs"}},"./schema.json":"./schema/chart-spec.schema.json","./package.json":"./package.json","./geo/us-states":{"import":{"types":"./dist/geo/us-states.d.ts","default":"./dist/geo/us-states.js"},"require":{"types":"./dist/geo/us-states.d.cts","default":"./dist/geo/us-states.cjs"}}},"scripts":{"dev":"tsup --watch","build":"rm -rf dist && tsup && node scripts/write-schema.mjs","typecheck":"tsc --noEmit -p tsconfig.json"},"_npmUser":{"name":"GitHub Actions","email":"npm-oidc-no-reply@github.com","trustedPublisher":{"id":"github","oidcConfigId":"37b15df9-644c-4f49-a568-91f91e14f812"}},"_resolved":"/home/runner/work/ztd-charts/ztd-charts/ztd-charts-0.9.0.tgz","_integrity":"sha512-C4rKNJoRR/z6IcbCBBG0ADfKmVhCrCOu/JIZKtHuxnoCYiFg4yi/rPqT/GBeSQmdE9nKoVYJyk8tSlXO+Bv25w==","repository":{"url":"git+https://github.com/Junhan2/ztd-charts.git","type":"git","directory":"packages/ztd-charts"},"_npmVersion":"11.19.1","description":"44 animated, interactive React charts in pure SVG with zero runtime dependencies, a JSON spec, and CLI and MCP tools for AI agents","directories":{},"sideEffects":false,"_nodeVersion":"24.22.2","_hasShrinkwrap":false,"devDependencies":{"tsup":"^9.0.0","react":"^19.3.1","react-dom":"^19.3.1","typescript":"5.9.3","@types/react":"^19.2.0","@types/react-dom":"^19.2.0"},"peerDependencies":{"react":">=18","react-dom":">=18"},"_npmOperationalInternal":{"tmp":"tmp/ztd-charts_0.9.0_1794444960416_0.6802324534059232","host":"s3://npm-registry-packages-npm-production"}},"0.10.0":{"name":"ztd-charts","version":"0.10.0","keywords":["react","chart","svg","animation","dataviz","korean","mcp"],"author":{"name":"Junhan2"},"license":"MIT","_id":"ztd-charts@0.10.0","maintainers":[{"name":"junhanleee","email":"junhanlee91@gmail.com"}],"homepage":"https://charts.ztd.app/","bugs":{"url":"https://github.com/Junhan2/ztd-charts/issues"},"dist":{"shasum":"c7d670c6dd536986dc8b8ca416870820f97994ef","tarball":"https://registry.npmjs.org/ztd-charts/-/ztd-charts-0.10.0.tgz","fileCount":80,"integrity":"sha512-egcZimJ/0c/3q5dcWBHEONb3CbnSYoSBY7OTNOz23LonAs5YSoIWQRFKsU3aGBqmh6+uoeUGnUBcJfvawVZJIw==","signatures":[{"sig":"MEYCIQC9wBL9UuQBUPnv6Gdiy+UZH13auoHgDAUXyz1PRgOxdgIhAKLxor95oFqKhMPwTCi3opbPIF4w1fBici874I8v4oCV","keyid":"SHA256:DhQ8wR5APBvFHLF/+Tc+AYvPOdTpcIDqOhxsBHRwC7U"},{"sig":"MEQCIGaJ13UIAgfWzcXhUnU7BUzcJReMaiMagHjIKLNETyM3AiB66xUqAlIbvLrkRwbRmY9kj0RmvmwILU7IgfvJPi9wLw==","keyid":"SHA256:DhQ8wR5APBvFHLF/+Tc+AYvPOdTpcIDqOhxsBHRwC7U"}],"attestations":{"url":"https://registry.npmjs.org/-/npm/v1/attestations/ztd-charts@0.10.0","provenance":{"predicateType":"https://slsa.dev/provenance/v1"}},"unpackedSize":6927715},"main":"./dist/index.cjs","type":"module","_from":"file:ztd-charts-0.10.0.tgz","types":"./dist/index.d.ts","module":"./dist/index.js","exports":{".":{"import":{"types":"./dist/index.d.ts","default":"./dist/index.js"},"require":{"types":"./dist/index.d.cts","default":"./dist/index.cjs"}},"./spec":{"import":{"types":"./dist/spec.d.ts","default":"./dist/spec.js"},"require":{"types":"./dist/spec.d.cts","default":"./dist/spec.cjs"}},"./server":{"import":{"types":"./dist/server.d.ts","default":"./dist/server.js"},"require":{"types":"./dist/server.d.cts","default":"./dist/server.cjs"}},"./schema/*":"./schema/*","./geo/world":{"import":{"types":"./dist/geo/world.d.ts","default":"./dist/geo/world.js"},"require":{"types":"./dist/geo/world.d.cts","default":"./dist/geo/world.cjs"}},"./geo/kr-sido":{"import":{"types":"./dist/geo/kr-sido.d.ts","default":"./dist/geo/kr-sido.js"},"require":{"types":"./dist/geo/kr-sido.d.cts","default":"./dist/geo/kr-sido.cjs"}},"./schema.json":"./schema/chart-spec.schema.json","./package.json":"./package.json","./geo/us-states":{"import":{"types":"./dist/geo/us-states.d.ts","default":"./dist/geo/us-states.js"},"require":{"types":"./dist/geo/us-states.d.cts","default":"./dist/geo/us-states.cjs"}}},"scripts":{"dev":"tsup --watch","build":"rm -rf dist && tsup && node scripts/write-schema.mjs","typecheck":"tsc --noEmit -p tsconfig.json"},"_npmUser":{"name":"GitHub Actions","email":"npm-oidc-no-reply@github.com","trustedPublisher":{"id":"github","oidcConfigId":"37b15df9-644c-4f49-a568-91f91e14f812"}},"_resolved":"/home/runner/work/ztd-charts/ztd-charts/ztd-charts-0.10.0.tgz","_integrity":"sha512-egcZimJ/0c/3q5dcWBHEONb3CbnSYoSBY7OTNOz23LonAs5YSoIWQRFKsU3aGBqmh6+uoeUGnUBcJfvawVZJIw==","repository":{"url":"git+https://github.com/Junhan2/ztd-charts.git","type":"git","directory":"packages/ztd-charts"},"_npmVersion":"11.19.1","description":"44 animated, interactive React charts in pure SVG with zero runtime dependencies, a JSON spec, and CLI and MCP tools for AI agents","directories":{},"sideEffects":false,"_nodeVersion":"24.22.2","_hasShrinkwrap":false,"devDependencies":{"tsup":"^9.0.0","react":"^19.3.1","react-dom":"^19.3.1","typescript":"5.9.3","@types/react":"^19.2.0","@types/react-dom":"^19.2.0"},"peerDependencies":{"react":">=18","react-dom":">=18"},"_npmOperationalInternal":{"tmp":"tmp/ztd-charts_0.10.0_1794460602032_0.7420262600518982","host":"s3://npm-registry-packages-npm-production"}},"0.11.0":{"name":"ztd-charts","version":"0.11.0","keywords":["react","chart","svg","animation","dataviz","korean","mcp"],"author":{"name":"Junhan2"},"license":"MIT","_id":"ztd-charts@0.11.0","maintainers":[{"name":"junhanleee","email":"junhanlee91@gmail.com"}],"homepage":"https://charts.ztd.app/","bugs":{"url":"https://github.com/Junhan2/ztd-charts/issues"},"dist":{"shasum":"d4d6f4f3f5a652ed8abb8ee6708c665fcdddad77","tarball":"https://registry.npmjs.org/ztd-charts/-/ztd-charts-0.11.0.tgz","fileCount":80,"integrity":"sha512-DR/kPNR8OAOf7QhCDwJVM2ZtfcQv7zW2zbG5+ImUTKISYw5a7H70D30vgn/2ncyvkoZ7q01hhMPo0MX5tE2NNA==","signatures":[{"sig":"MEUCIQChQfzdFxhA+HJk+4KQQHUK2LnGTWZ/YeRBR/yehEgNrQIgFscnlX2XbgxBN2onQpTX2ir7Bjfisk+6Jxd50iH75+c=","keyid":"SHA256:DhQ8wR5APBvFHLF/+Tc+AYvPOdTpcIDqOhxsBHRwC7U"},{"sig":"MEUCID0fLAEA5aswh8UaeNwRd8KF+br1Q148xP/J3szH5Q8iAiEA/5ZTyH+xG/jprBKRy6XAuDij2zvDb1jkXgaSTT+UFhk=","keyid":"SHA256:DhQ8wR5APBvFHLF/+Tc+AYvPOdTpcIDqOhxsBHRwC7U"}],"attestations":{"url":"https://registry.npmjs.org/-/npm/v1/attestations/ztd-charts@0.11.0","provenance":{"predicateType":"https://slsa.dev/provenance/v1"}},"unpackedSize":6957480},"main":"./dist/index.cjs","type":"module","_from":"file:ztd-charts-0.11.0.tgz","types":"./dist/index.d.ts","module":"./dist/index.js","exports":{".":{"import":{"types":"./dist/index.d.ts","default":"./dist/index.js"},"require":{"types":"./dist/index.d.cts","default":"./dist/index.cjs"}},"./spec":{"import":{"types":"./dist/spec.d.ts","default":"./dist/spec.js"},"require":{"types":"./dist/spec.d.cts","default":"./dist/spec.cjs"}},"./server":{"import":{"types":"./dist/server.d.ts","default":"./dist/server.js"},"require":{"types":"./dist/server.d.cts","default":"./dist/server.cjs"}},"./schema/*":"./schema/*","./geo/world":{"import":{"types":"./dist/geo/world.d.ts","default":"./dist/geo/world.js"},"require":{"types":"./dist/geo/world.d.cts","default":"./dist/geo/world.cjs"}},"./geo/kr-sido":{"import":{"types":"./dist/geo/kr-sido.d.ts","default":"./dist/geo/kr-sido.js"},"require":{"types":"./dist/geo/kr-sido.d.cts","default":"./dist/geo/kr-sido.cjs"}},"./schema.json":"./schema/chart-spec.schema.json","./package.json":"./package.json","./geo/us-states":{"import":{"types":"./dist/geo/us-states.d.ts","default":"./dist/geo/us-states.js"},"require":{"types":"./dist/geo/us-states.d.cts","default":"./dist/geo/us-states.cjs"}}},"scripts":{"dev":"tsup --watch","build":"rm -rf dist && tsup && node scripts/write-schema.mjs","typecheck":"tsc --noEmit -p tsconfig.json"},"_npmUser":{"name":"GitHub Actions","email":"npm-oidc-no-reply@github.com","trustedPublisher":{"id":"github","oidcConfigId":"37b15df9-644c-4f49-a568-91f91e14f812"}},"_resolved":"/home/runner/work/ztd-charts/ztd-charts/ztd-charts-0.11.0.tgz","_integrity":"sha512-DR/kPNR8OAOf7QhCDwJVM2ZtfcQv7zW2zbG5+ImUTKISYw5a7H70D30vgn/2ncyvkoZ7q01hhMPo0MX5tE2NNA==","repository":{"url":"git+https://github.com/Junhan2/ztd-charts.git","type":"git","directory":"packages/ztd-charts"},"_npmVersion":"11.19.1","description":"44 animated, interactive React charts in pure SVG with zero runtime dependencies, a JSON spec, and CLI and MCP tools for AI agents","directories":{},"sideEffects":false,"_nodeVersion":"24.22.2","_hasShrinkwrap":false,"devDependencies":{"tsup":"^9.0.0","react":"^19.3.1","react-dom":"^19.3.1","typescript":"5.9.3","@types/react":"^19.2.0","@types/react-dom":"^19.2.0"},"peerDependencies":{"react":">=18","react-dom":">=18"},"_npmOperationalInternal":{"tmp":"tmp/ztd-charts_0.11.0_1794467209479_0.6949327849018856","host":"s3://npm-registry-packages-npm-production"}},"0.11.1":{"name":"ztd-charts","version":"0.11.1","keywords":["react","chart","svg","animation","dataviz","korean","mcp"],"author":{"name":"Junhan2"},"license":"MIT","_id":"ztd-charts@0.11.1","maintainers":[{"name":"junhanleee","email":"junhanlee91@gmail.com"}],"homepage":"https://charts.ztd.app/","bugs":{"url":"https://github.com/Junhan2/ztd-charts/issues"},"dist":{"shasum":"0b0191d53daae5639ccc9ee4edee430ff9da4a27","tarball":"https://registry.npmjs.org/ztd-charts/-/ztd-charts-0.11.1.tgz","fileCount":80,"integrity":"sha512-IenUe3FBaKNKNQzMpfiWyFL1RIg0Ari1v5Z9yq7kkNl2HSwIYkS+EWD32I3C6ENxBuSEvrIFEtNwulEBnpJyBg==","signatures":[{"sig":"MEQCIBLWyJL384CsKI365rDBU4fqBy1qTNwn12OxUhb+lOopAiAZ6UafTyFOa2tBXumhMByyQgESZAT8j1A4W0++CaXwHg==","keyid":"SHA256:DhQ8wR5APBvFHLF/+Tc+AYvPOdTpcIDqOhxsBHRwC7U"},{"sig":"MEYCIQDEWAJfTp6E71mjwEbrpDeFHKPnVEp7gyYUT99E1NMWYwIhAPVyltLYEMSqdO/U1H7GfzEfpUNl+Te/ESPAV6CTjxr7","keyid":"SHA256:DhQ8wR5APBvFHLF/+Tc+AYvPOdTpcIDqOhxsBHRwC7U"}],"attestations":{"url":"https://registry.npmjs.org/-/npm/v1/attestations/ztd-charts@0.11.1","provenance":{"predicateType":"https://slsa.dev/provenance/v1"}},"unpackedSize":6953935},"main":"./dist/index.cjs","type":"module","_from":"file:ztd-charts-0.11.1.tgz","types":"./dist/index.d.ts","module":"./dist/index.js","exports":{".":{"import":{"types":"./dist/index.d.ts","default":"./dist/index.js"},"require":{"types":"./dist/index.d.cts","default":"./dist/index.cjs"}},"./spec":{"import":{"types":"./dist/spec.d.ts","default":"./dist/spec.js"},"require":{"types":"./dist/spec.d.cts","default":"./dist/spec.cjs"}},"./server":{"import":{"types":"./dist/server.d.ts","default":"./dist/server.js"},"require":{"types":"./dist/server.d.cts","default":"./dist/server.cjs"}},"./schema/*":"./schema/*","./geo/world":{"import":{"types":"./dist/geo/world.d.ts","default":"./dist/geo/world.js"},"require":{"types":"./dist/geo/world.d.cts","default":"./dist/geo/world.cjs"}},"./geo/kr-sido":{"import":{"types":"./dist/geo/kr-sido.d.ts","default":"./dist/geo/kr-sido.js"},"require":{"types":"./dist/geo/kr-sido.d.cts","default":"./dist/geo/kr-sido.cjs"}},"./schema.json":"./schema/chart-spec.schema.json","./package.json":"./package.json","./geo/us-states":{"import":{"types":"./dist/geo/us-states.d.ts","default":"./dist/geo/us-states.js"},"require":{"types":"./dist/geo/us-states.d.cts","default":"./dist/geo/us-states.cjs"}}},"scripts":{"dev":"tsup --watch","build":"rm -rf dist && tsup && node scripts/write-schema.mjs","typecheck":"tsc --noEmit -p tsconfig.json"},"_npmUser":{"name":"GitHub Actions","email":"npm-oidc-no-reply@github.com","trustedPublisher":{"id":"github","oidcConfigId":"37b15df9-644c-4f49-a568-91f91e14f812"}},"_resolved":"/home/runner/work/ztd-charts/ztd-charts/ztd-charts-0.11.1.tgz","_integrity":"sha512-IenUe3FBaKNKNQzMpfiWyFL1RIg0Ari1v5Z9yq7kkNl2HSwIYkS+EWD32I3C6ENxBuSEvrIFEtNwulEBnpJyBg==","repository":{"url":"git+https://github.com/Junhan2/ztd-charts.git","type":"git","directory":"packages/ztd-charts"},"_npmVersion":"11.19.1","description":"44 animated, interactive React charts in pure SVG with zero runtime dependencies, a JSON spec, and CLI and MCP tools for AI agents","directories":{},"sideEffects":false,"_nodeVersion":"24.22.2","_hasShrinkwrap":false,"devDependencies":{"tsup":"^9.0.0","react":"^19.3.1","react-dom":"^19.3.1","typescript":"5.9.3","@types/react":"^19.2.0","@types/react-dom":"^19.2.0"},"peerDependencies":{"react":">=18","react-dom":">=18"},"_npmOperationalInternal":{"tmp":"tmp/ztd-charts_0.11.1_1794476577329_0.49623859031324113","host":"s3://npm-registry-packages-npm-production"}},"0.11.2":{"name":"ztd-charts","version":"0.11.2","keywords":["react","chart","svg","animation","dataviz","korean","mcp"],"author":{"name":"Junhan2"},"license":"MIT","_id":"ztd-charts@0.11.2","maintainers":[{"name":"junhanleee","email":"junhanlee91@gmail.com"}],"homepage":"https://charts.ztd.app/","bugs":{"url":"https://github.com/Junhan2/ztd-charts/issues"},"dist":{"shasum":"692bd005a6a9aa05523aa86adf29c0fc89c2a1e7","tarball":"https://registry.npmjs.org/ztd-charts/-/ztd-charts-0.11.2.tgz","fileCount":80,"integrity":"sha512-mHqth6hDxhEk2Qi/5Yh6ChqACjjumM8I4YUKThr+YYkXmjbyWTghsAgZJs1g1mRDpHUXtaKWnYzRJKAltcBI5Q==","signatures":[{"sig":"MEQCIFhRwGbLEuqddav9u/nVGJxlNPQ77Gryzyr1ykKGLI0hAiA39Ffq8YeQRzSyB6cXXzKXTHqj2iU24M7lvtGKDVdpnA==","keyid":"SHA256:DhQ8wR5APBvFHLF/+Tc+AYvPOdTpcIDqOhxsBHRwC7U"},{"sig":"MEUCICc4I9B0874etYGNnj8i7t5CCeKLCuPk5PmgAHINC9caAiEAs027M8vZSEs7On+bMKv02izmapZCjEswRLBGMHOWtf0=","keyid":"SHA256:DhQ8wR5APBvFHLF/+Tc+AYvPOdTpcIDqOhxsBHRwC7U"}],"attestations":{"url":"https://registry.npmjs.org/-/npm/v1/attestations/ztd-charts@0.11.2","provenance":{"predicateType":"https://slsa.dev/provenance/v1"}},"unpackedSize":6956478},"main":"./dist/index.cjs","type":"module","_from":"file:ztd-charts-0.11.2.tgz","types":"./dist/index.d.ts","module":"./dist/index.js","exports":{".":{"import":{"types":"./dist/index.d.ts","default":"./dist/index.js"},"require":{"types":"./dist/index.d.cts","default":"./dist/index.cjs"}},"./spec":{"import":{"types":"./dist/spec.d.ts","default":"./dist/spec.js"},"require":{"types":"./dist/spec.d.cts","default":"./dist/spec.cjs"}},"./server":{"import":{"types":"./dist/server.d.ts","default":"./dist/server.js"},"require":{"types":"./dist/server.d.cts","default":"./dist/server.cjs"}},"./schema/*":"./schema/*","./geo/world":{"import":{"types":"./dist/geo/world.d.ts","default":"./dist/geo/world.js"},"require":{"types":"./dist/geo/world.d.cts","default":"./dist/geo/world.cjs"}},"./geo/kr-sido":{"import":{"types":"./dist/geo/kr-sido.d.ts","default":"./dist/geo/kr-sido.js"},"require":{"types":"./dist/geo/kr-sido.d.cts","default":"./dist/geo/kr-sido.cjs"}},"./schema.json":"./schema/chart-spec.schema.json","./package.json":"./package.json","./geo/us-states":{"import":{"types":"./dist/geo/us-states.d.ts","default":"./dist/geo/us-states.js"},"require":{"types":"./dist/geo/us-states.d.cts","default":"./dist/geo/us-states.cjs"}}},"scripts":{"dev":"tsup --watch","build":"rm -rf dist && tsup && node scripts/write-schema.mjs","typecheck":"tsc --noEmit -p tsconfig.json"},"_npmUser":{"name":"GitHub Actions","email":"npm-oidc-no-reply@github.com","trustedPublisher":{"id":"github","oidcConfigId":"37b15df9-644c-4f49-a568-91f91e14f812"}},"_resolved":"/home/runner/work/ztd-charts/ztd-charts/ztd-charts-0.11.2.tgz","_integrity":"sha512-mHqth6hDxhEk2Qi/5Yh6ChqACjjumM8I4YUKThr+YYkXmjbyWTghsAgZJs1g1mRDpHUXtaKWnYzRJKAltcBI5Q==","repository":{"url":"git+https://github.com/Junhan2/ztd-charts.git","type":"git","directory":"packages/ztd-charts"},"_npmVersion":"11.19.1","description":"44 animated, interactive React charts in pure SVG with zero runtime dependencies, a JSON spec, and CLI and MCP tools for AI agents","directories":{},"sideEffects":false,"_nodeVersion":"24.22.2","_hasShrinkwrap":false,"devDependencies":{"tsup":"^9.0.0","react":"^19.3.1","react-dom":"^19.3.1","typescript":"5.9.3","@types/react":"^19.2.0","@types/react-dom":"^19.2.0"},"peerDependencies":{"react":">=18","react-dom":">=18"},"_npmOperationalInternal":{"tmp":"tmp/ztd-charts_0.11.2_1794489188248_0.6486765430584072","host":"s3://npm-registry-packages-npm-production"}},"0.11.3":{"name":"ztd-charts","version":"0.11.3","keywords":["react","chart","svg","animation","dataviz","korean","mcp"],"author":{"name":"Junhan2"},"license":"MIT","_id":"ztd-charts@0.11.3","maintainers":[{"name":"junhanleee","email":"junhanlee91@gmail.com"}],"homepage":"https://charts.ztd.app/","bugs":{"url":"https://github.com/Junhan2/ztd-charts/issues"},"dist":{"shasum":"4ef8cfd71d5096f3f54bfdca1f28a5276758967b","tarball":"https://registry.npmjs.org/ztd-charts/-/ztd-charts-0.11.3.tgz","fileCount":80,"integrity":"sha512-ppx+AdMru0zGDtqJvdgWzGsWfOAG+DkpKoZ4EXHeqSSU3mjvqeDCtqMTRko8y0H0oTit9NljOZD7Y94Wihz0UQ==","signatures":[{"sig":"MEQCIAG1IxBzi5Yv4bQp20qkcGPJl/L7q0YJPSiRsirAPsCVAiA98gL2oEj7Bx6yweDxLRoOa7Ja5rOcxoLT7tra83liNA==","keyid":"SHA256:DhQ8wR5APBvFHLF/+Tc+AYvPOdTpcIDqOhxsBHRwC7U"},{"sig":"MEUCIFVVzoLmByqJcF1jsmOVrkvJ1aKFh/vKNtHVXX8VKIrnAiEAxapU13lH4R8qY24m0hzHc04ckDfi5s+n2DuylDOnkYQ=","keyid":"SHA256:DhQ8wR5APBvFHLF/+Tc+AYvPOdTpcIDqOhxsBHRwC7U"}],"attestations":{"url":"https://registry.npmjs.org/-/npm/v1/attestations/ztd-charts@0.11.3","provenance":{"predicateType":"https://slsa.dev/provenance/v1"}},"unpackedSize":6963139},"main":"./dist/index.cjs","type":"module","_from":"file:ztd-charts-0.11.3.tgz","types":"./dist/index.d.ts","module":"./dist/index.js","exports":{".":{"import":{"types":"./dist/index.d.ts","default":"./dist/index.js"},"require":{"types":"./dist/index.d.cts","default":"./dist/index.cjs"}},"./spec":{"import":{"types":"./dist/spec.d.ts","default":"./dist/spec.js"},"require":{"types":"./dist/spec.d.cts","default":"./dist/spec.cjs"}},"./server":{"import":{"types":"./dist/server.d.ts","default":"./dist/server.js"},"require":{"types":"./dist/server.d.cts","default":"./dist/server.cjs"}},"./schema/*":"./schema/*","./geo/world":{"import":{"types":"./dist/geo/world.d.ts","default":"./dist/geo/world.js"},"require":{"types":"./dist/geo/world.d.cts","default":"./dist/geo/world.cjs"}},"./geo/kr-sido":{"import":{"types":"./dist/geo/kr-sido.d.ts","default":"./dist/geo/kr-sido.js"},"require":{"types":"./dist/geo/kr-sido.d.cts","default":"./dist/geo/kr-sido.cjs"}},"./schema.json":"./schema/chart-spec.schema.json","./package.json":"./package.json","./geo/us-states":{"import":{"types":"./dist/geo/us-states.d.ts","default":"./dist/geo/us-states.js"},"require":{"types":"./dist/geo/us-states.d.cts","default":"./dist/geo/us-states.cjs"}}},"scripts":{"dev":"tsup --watch","build":"rm -rf dist && tsup && node scripts/write-schema.mjs","typecheck":"tsc --noEmit -p tsconfig.json"},"_npmUser":{"name":"GitHub Actions","email":"npm-oidc-no-reply@github.com","trustedPublisher":{"id":"github","oidcConfigId":"37b15df9-644c-4f49-a568-91f91e14f812"}},"_resolved":"/home/runner/work/ztd-charts/ztd-charts/ztd-charts-0.11.3.tgz","_integrity":"sha512-ppx+AdMru0zGDtqJvdgWzGsWfOAG+DkpKoZ4EXHeqSSU3mjvqeDCtqMTRko8y0H0oTit9NljOZD7Y94Wihz0UQ==","repository":{"url":"git+https://github.com/Junhan2/ztd-charts.git","type":"git","directory":"packages/ztd-charts"},"_npmVersion":"11.19.1","description":"44 animated, interactive React charts in pure SVG with zero runtime dependencies, a JSON spec, and CLI and MCP tools for AI agents","directories":{},"sideEffects":false,"_nodeVersion":"24.22.2","_hasShrinkwrap":false,"devDependencies":{"tsup":"^9.0.0","react":"^19.3.1","react-dom":"^19.3.1","typescript":"5.9.3","@types/react":"^19.2.0","@types/react-dom":"^19.2.0"},"peerDependencies":{"react":">=18","react-dom":">=18"},"_npmOperationalInternal":{"tmp":"tmp/ztd-charts_0.11.3_1794494195124_0.314316072868813","host":"s3://npm-registry-packages-npm-production"}},"0.12.0":{"_id":"ztd-charts@0.12.0","bugs":{"url":"https://github.com/Junhan2/ztd-charts/issues"},"dist":{"shasum":"7000461c9ad1ccf550f23700ad47fc9fada44c12","tarball":"https://registry.npmjs.org/ztd-charts/-/ztd-charts-0.12.0.tgz","fileCount":80,"integrity":"sha512-6JmB7OprPj/KaWmMeqLLLRWqTelEB2HmwJdsxKtrTb5RK0IoWjE6TEFEvA6S3w6IbyCr6Ra82pJBJ7CesUdQvA==","signatures":[{"sig":"MEQCIB4yOCMtRy4RX+UK/8TxeBRgZpRFGqHaFkuBATUUv2VEAiApad1VHSJqw86MzZdRyhar+3XIi25+2wcM4PuGX1Xeeg==","keyid":"SHA256:DhQ8wR5APBvFHLF/+Tc+AYvPOdTpcIDqOhxsBHRwC7U"},{"keyid":"SHA256:DhQ8wR5APBvFHLF/+Tc+AYvPOdTpcIDqOhxsBHRwC7U","sig":"MEUCIQCh0QfHplsaZt9GzKZFTDJXAQh1/4apBN6sAOSEsQlPvwIgBmkAGi0PeLYlsYT97vIw3gDbd7n/mOPbqn9zHLxRkig="}],"attestations":{"url":"https://registry.npmjs.org/-/npm/v1/attestations/ztd-charts@0.12.0","provenance":{"predicateType":"https://slsa.dev/provenance/v1"}},"unpackedSize":7076597},"main":"./dist/index.cjs","name":"ztd-charts","type":"module","_from":"file:ztd-charts-0.12.0.tgz","types":"./dist/index.d.ts","author":{"name":"Junhan2"},"module":"./dist/index.js","exports":{".":{"import":{"types":"./dist/index.d.ts","default":"./dist/index.js"},"require":{"types":"./dist/index.d.cts","default":"./dist/index.cjs"}},"./spec":{"import":{"types":"./dist/spec.d.ts","default":"./dist/spec.js"},"require":{"types":"./dist/spec.d.cts","default":"./dist/spec.cjs"}},"./server":{"import":{"types":"./dist/server.d.ts","default":"./dist/server.js"},"require":{"types":"./dist/server.d.cts","default":"./dist/server.cjs"}},"./schema/*":"./schema/*","./geo/world":{"import":{"types":"./dist/geo/world.d.ts","default":"./dist/geo/world.js"},"require":{"types":"./dist/geo/world.d.cts","default":"./dist/geo/world.cjs"}},"./geo/kr-sido":{"import":{"types":"./dist/geo/kr-sido.d.ts","default":"./dist/geo/kr-sido.js"},"require":{"types":"./dist/geo/kr-sido.d.cts","default":"./dist/geo/kr-sido.cjs"}},"./schema.json":"./schema/chart-spec.schema.json","./package.json":"./package.json","./geo/us-states":{"import":{"types":"./dist/geo/us-states.d.ts","default":"./dist/geo/us-states.js"},"require":{"types":"./dist/geo/us-states.d.cts","default":"./dist/geo/us-states.cjs"}}},"license":"MIT","scripts":{"dev":"tsup --watch","build":"rm -rf dist && tsup && node scripts/write-schema.mjs","typecheck":"tsc --noEmit -p tsconfig.json"},"version":"0.12.0","_npmUser":{"name":"GitHub Actions","email":"npm-oidc-no-reply@github.com","trustedPublisher":{"id":"github","oidcConfigId":"37b15df9-644c-4f49-a568-91f91e14f812"}},"homepage":"https://charts.ztd.app/","keywords":["react","chart","svg","animation","dataviz","korean","mcp"],"_resolved":"/home/runner/work/ztd-charts/ztd-charts/ztd-charts-0.12.0.tgz","_integrity":"sha512-6JmB7OprPj/KaWmMeqLLLRWqTelEB2HmwJdsxKtrTb5RK0IoWjE6TEFEvA6S3w6IbyCr6Ra82pJBJ7CesUdQvA==","repository":{"url":"git+https://github.com/Junhan2/ztd-charts.git","type":"git","directory":"packages/ztd-charts"},"_npmVersion":"11.19.1","description":"44 animated, interactive React charts in pure SVG with zero runtime dependencies, a JSON spec, and CLI and MCP tools for AI agents","directories":{},"maintainers":[{"name":"junhanleee","email":"junhanlee91@gmail.com"}],"sideEffects":false,"_nodeVersion":"24.22.2","_hasShrinkwrap":false,"devDependencies":{"tsup":"^9.0.0","react":"^19.3.1","react-dom":"^19.3.1","typescript":"5.9.3","@types/react":"^19.2.0","@types/react-dom":"^19.2.0"},"peerDependencies":{"react":">=18","react-dom":">=18"},"_npmOperationalInternal":{"host":"s3://npm-registry-packages-npm-production","tmp":"tmp/ztd-charts_0.12.0_1794819398593_0.39545463932967906"}}},"time":{"created":"2026-11-05T05:02:43.882Z","modified":"2026-11-16T08:56:39.346Z","0.0.0-stage":"2026-11-05T05:02:43.882Z","0.2.0":"2026-11-05T05:07:53.272Z","0.2.1":"2026-11-05T14:10:35.156Z","0.3.0":"2026-11-07T15:45:01.793Z","0.4.0":"2026-11-07T15:46:20.965Z","0.4.1":"2026-11-08T09:09:35.113Z","0.5.0":"2026-11-09T04:24:31.370Z","0.5.1":"2026-11-09T16:13:52.948Z","0.6.0":"2026-11-10T00:31:20.893Z","0.7.0":"2026-11-10T13:33:06.579Z","0.8.0":"2026-11-11T02:48:32.483Z","0.9.0":"2026-11-12T00:56:00.554Z","0.10.0":"2026-11-12T05:16:42.160Z","0.11.0":"2026-11-12T07:06:49.652Z","0.11.1":"2026-11-12T09:42:57.479Z","0.11.2":"2026-11-12T13:13:08.436Z","0.11.3":"2026-11-12T14:36:35.314Z","0.12.0":"2026-11-16T08:56:38.719Z"},"bugs":{"url":"https://github.com/Junhan2/ztd-charts/issues"},"author":{"name":"Junhan2"},"license":"MIT","homepage":"https://charts.ztd.app/","keywords":["react","chart","svg","animation","dataviz","korean","mcp"],"repository":{"url":"git+https://github.com/Junhan2/ztd-charts.git","type":"git","directory":"packages/ztd-charts"},"description":"44 animated, interactive React charts in pure SVG with zero runtime dependencies, a JSON spec, and CLI and MCP tools for AI agents","maintainers":[{"name":"junhanleee","email":"junhanlee91@gmail.com"}],"readme":"# ztd charts\n\nAnimated, accessible React charts that read like a report. 44 charts in pure SVG with no runtime dependencies, and a JSON spec your AI agent can write.\n\n[Website](https://charts.ztd.app) · [Gallery](https://charts.ztd.app/docs/) · [Docs](https://charts.ztd.app/docs/docs/) · [Example dashboards](https://charts.ztd.app/docs/examples/) · [GitHub](https://github.com/Junhan2/ztd-charts) · [한국어](https://github.com/Junhan2/ztd-charts/blob/main/README.ko.md)\n\n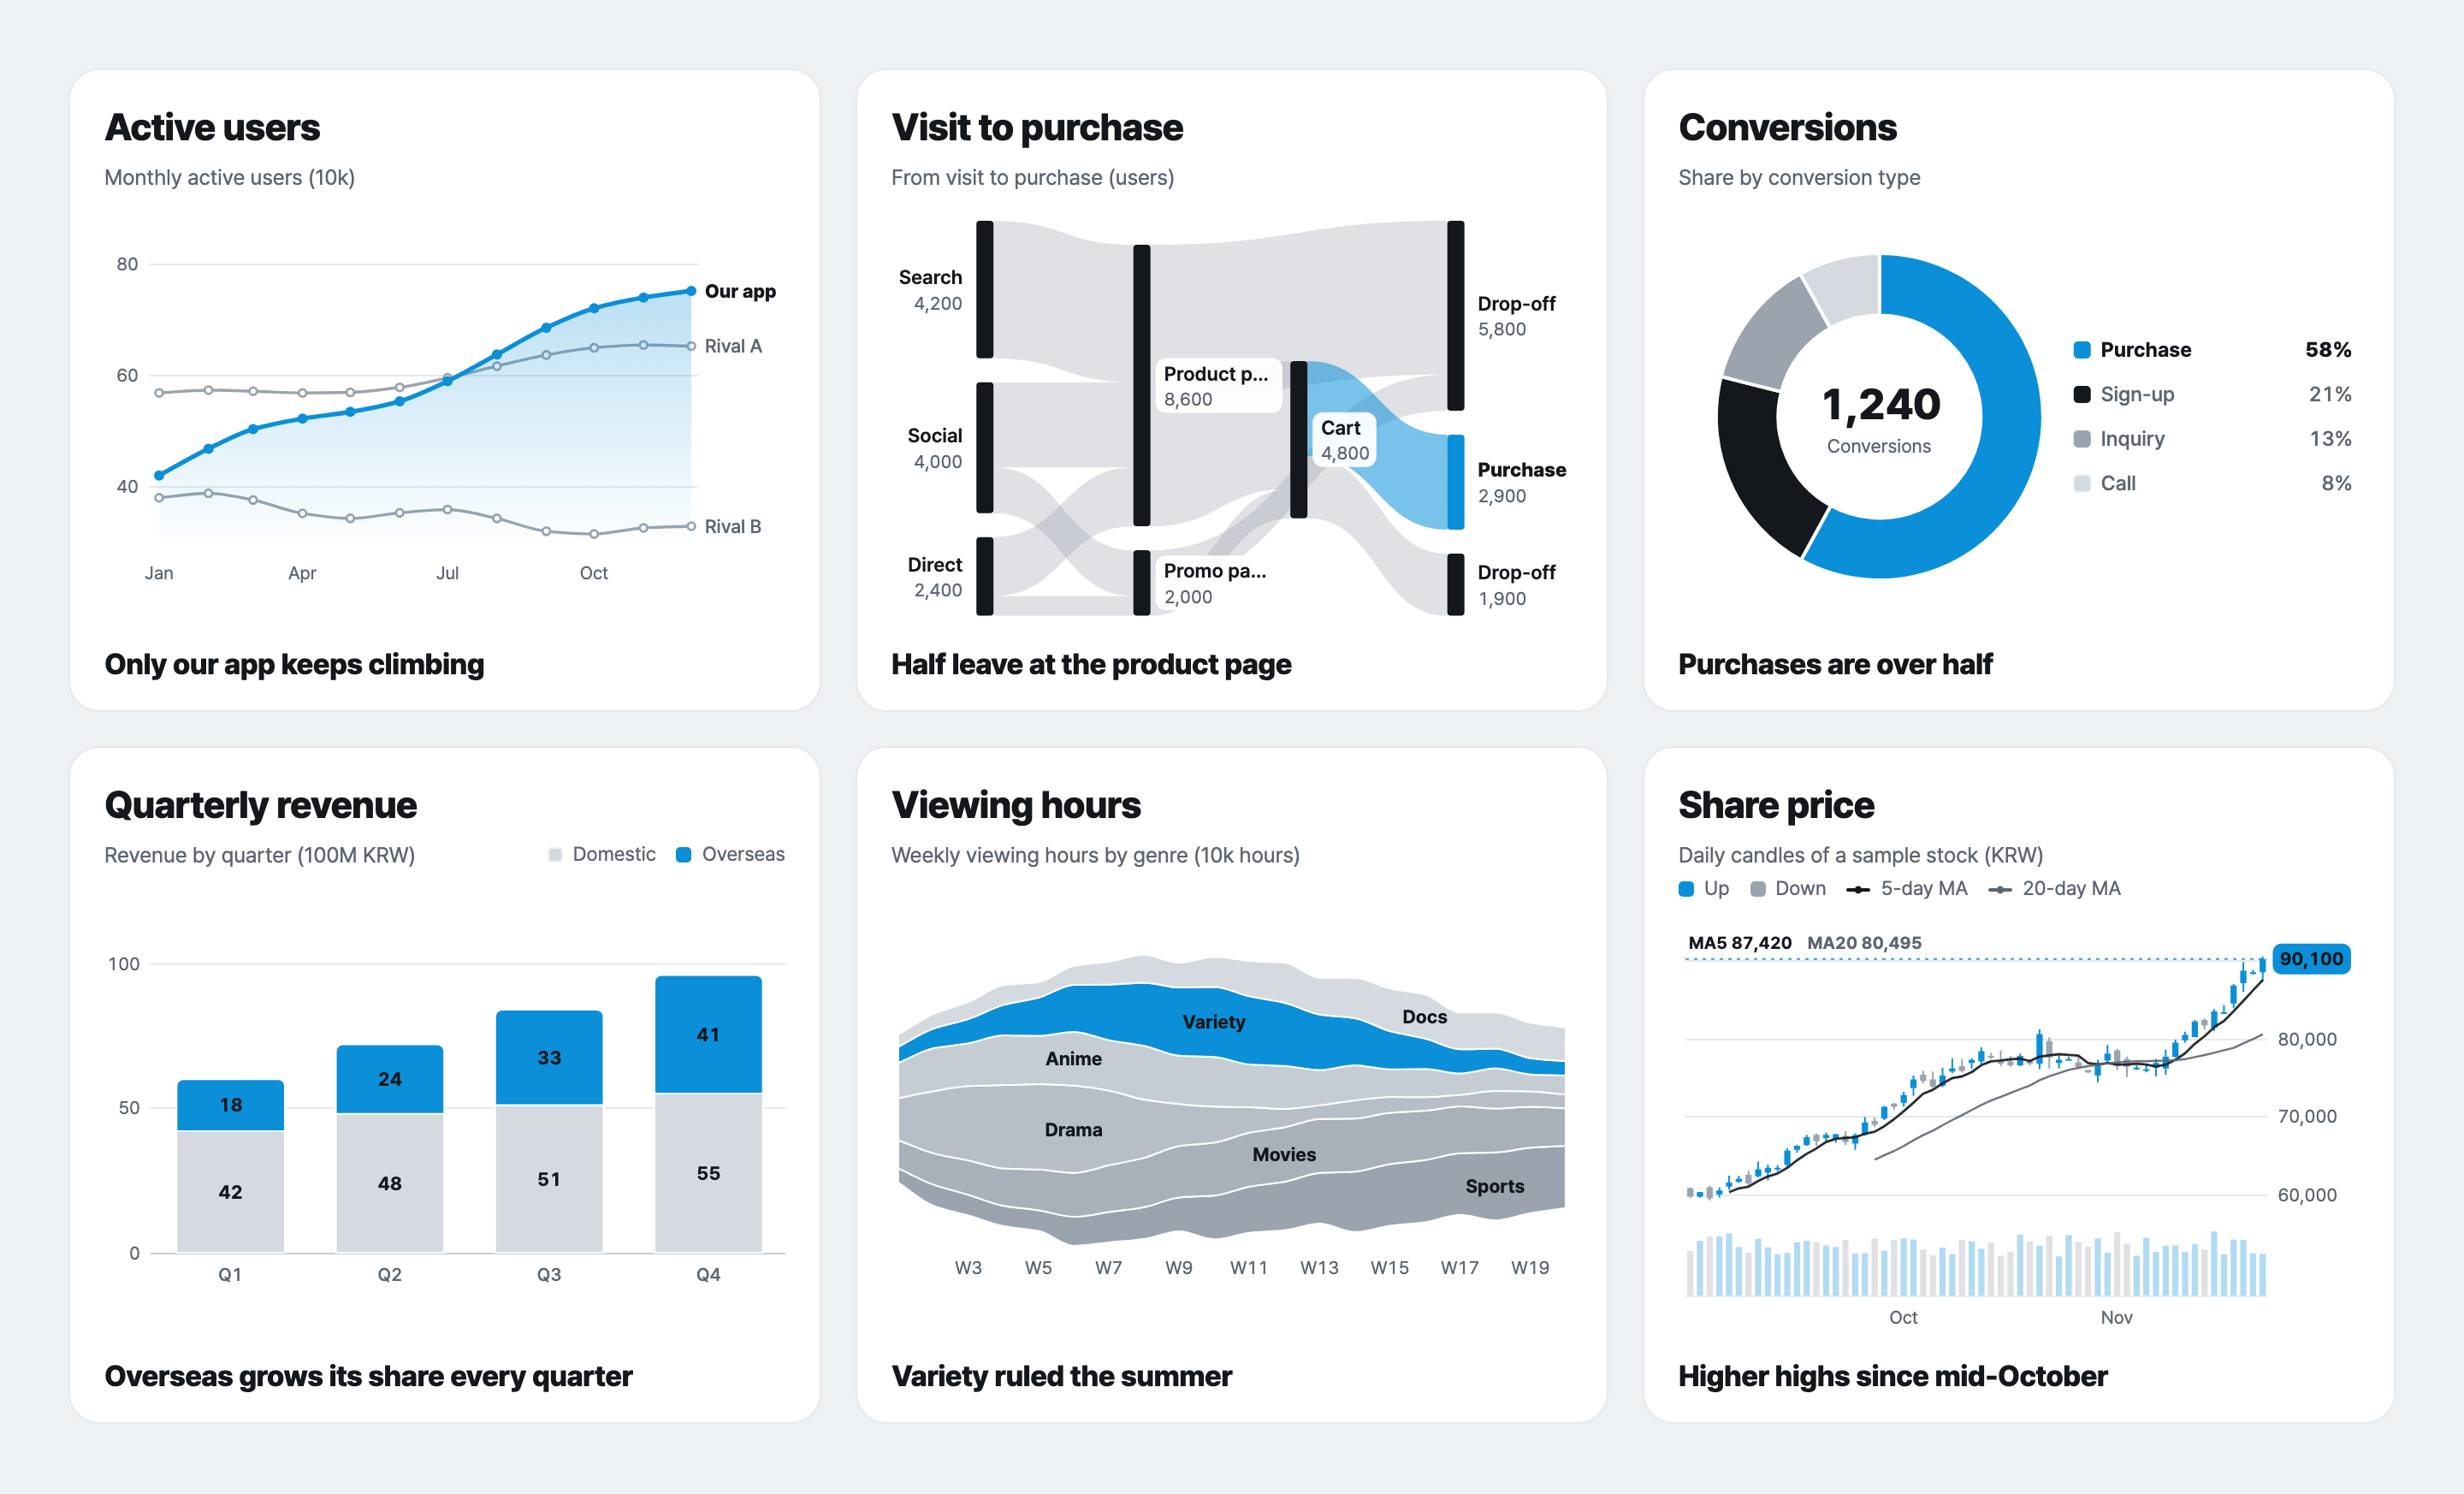\n\n## Why ztd charts\n\n- **Each card says one thing.** One item takes the accent color and the rest stay neutral, with a bold takeaway under the chart, so a reader sees the point before reading the axes.\n- **Motion that explains.** Charts draw in as they scroll into view, move on from where they are when the data changes, and let you drag over a range to read its change, high and low.\n- **Accessible by default.** Keyboard navigation, a screen reader description and data table for every chart, reduced motion, and every label at WCAG AA contrast.\n- **Small, with nothing else to install.** React is the only peer dependency. A chart with the shared core is about 12 to 26 kB Brotli, and very large data switches to canvas on its own.\n- **Ready for AI.** Every chart is also a JSON spec with a public JSON Schema, and a CLI, an MCP server and an agent skill validate it and render it to PNG, SVG or HTML.\n- **English and Korean.** en-US by default. `locale=\"ko-KR\"` switches number formats (1.2만, 3.4억) and chart text to Korean.\n\n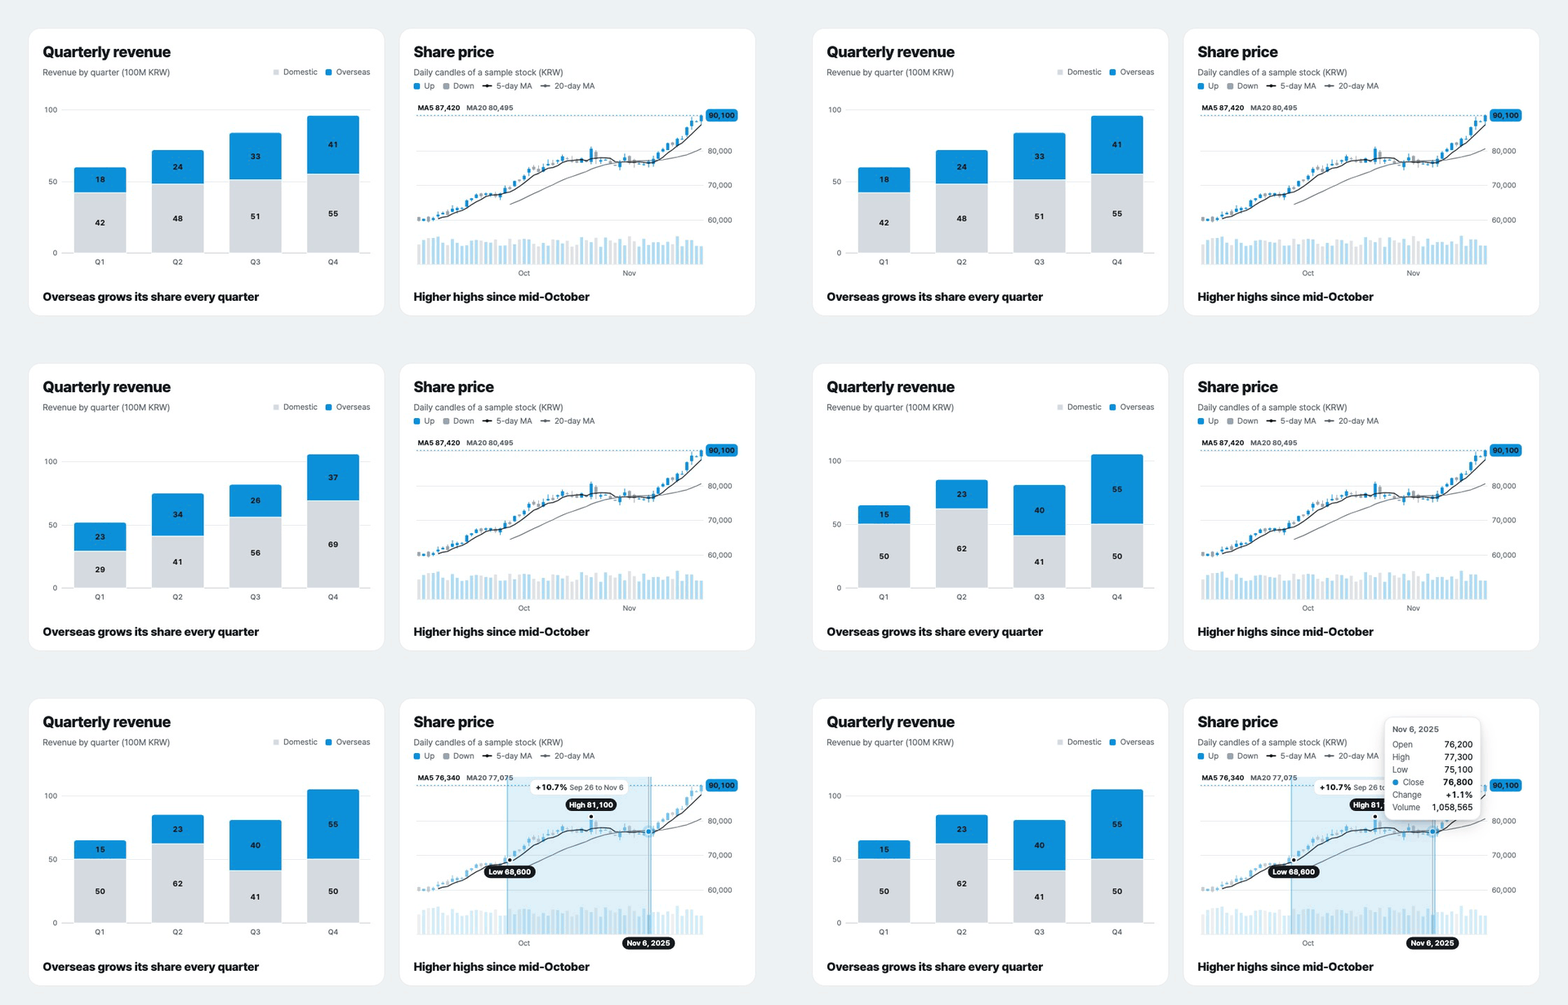\n\n## Quick start\n\n```bash\nnpm i ztd-charts\n```\n\n```tsx\nimport { ChartCard, PieChart } from \"ztd-charts\";\n\nconst sales = [\n { device: \"Mobile\", share: 72 },\n { device: \"Desktop\", share: 23 },\n { device: \"Tablet\", share: 5 },\n];\n\nexport function SalesByDevice() {\n return (\n \n \n \n );\n}\n```\n\nEvery chart page in the [gallery](https://charts.ztd.app/docs/) has the React code, the JSON spec and the CLI command for that chart.\n\n## What's in the package\n\n- `ztd-charts`: 44 chart components, `LiveLineChart`, `ChartCard`, `ChartGrid`, `ChartFacets`, `StatCard`, `ThemeProvider`, `registerMap` and the data helpers.\n- `ztd-charts/spec`: the chart registry, JSON Schema, spec validation and chart suggestions, without React. `FACET_TYPES` and `FACET_MAX` say which charts take `facet` and how many panels it draws.\n- `ztd-charts/server`: server rendering to SVG and HTML, with every built-in map already registered.\n- `ztd-charts/geo/world`, `ztd-charts/geo/us-states` and `ztd-charts/geo/kr-sido`: map boundaries, one entry point per map, so a page that draws no map loads none.\n- `ztd-charts/schema.json`: the JSON Schema for chart specs.\n\nNew in 0.12.0: five options, each with its own variant in the gallery. `variant: \"raincloud\"` on `BoxPlot` draws each group as a half density curve, a thin box and every sample as a dot. `hull` on `ScatterChart` outlines each series with a rounded shape in its color, under the dots. `dimensions` on `SankeyChart` (`encoding.dimensions` in a spec) reads a wide table where each row is one path through 2 to 6 stage columns, so no link rows are needed. `flow: \"right\"` on `FunnelChart` runs the stages from left to right for low, wide cards. `centerLabels` on `BarChart` puts the row names of diverging horizontal bars in a column at the zero line, as in a population pyramid. New spec aliases: `raincloud`, `alluvial`, `parallelSets`, `butterfly`, `pyramid` and `populationPyramid`.\n\nNew in 0.11.3: on a wide `FlowMap`, flows that cross the map edge now stop at the edge of the chart. They were clipped to the globe's outline, which lies outside the svg when the map is fitted to its places (about 21px past it in the example at 1200px wide), so their ends and arrowheads drew into the card padding. The comments in the sources and the JSDoc in the type definitions are now in English, so editors show English hover text.\n\nNew in 0.11.2: the period label behind a `BarRace` (the large year or date) now meets WCAG AA contrast on the card, instead of 1.55:1 in dark and 1.33:1 in light. It uses the theme's `ink` at the lowest opacity that reaches the minimum for its size: 3:1 for large text (36% in dark, 47% in light), and 4.5:1 when a narrow chart draws it below 18.66px (48% and 60%). It stays quiet behind the bars, and a custom theme gets its own opacity from its `ink` and `panel` colors.\n\nNew in 0.11.1: the Skyline example shows the last 7 days instead of 14, so each day keeps its own block and date in a gallery card, and the Timeline example shows the status strip with a status legend. The timeline variant \"Status strip\" is now \"Status colors on bars\" (`status-bars`), which colors the bars by status without the strip.\n\nNew in 0.11.0: `statusStrip` on `Timeline` (`options.statusStrip` in a spec) adds the status strip as the bottom row. Consecutive items with the same `status` join into one labelled segment in the legend's status colors, and pointing at the strip picks the item that set the state there. The bars then show durations, with the longest in the accent. It is off by default, and the \"Status strip\" variant now shows this form.\n\nNew in 0.10.0: two more theme colors, `accent2` (pink) and `accent3` (the other theme's accent: lime in light, sky in dark), each at least 3:1 against the card and `neutralSoft`. `SkylineChart` paints its front row with them in the high view and splits the top of each tile by series share, so failures and retries stay readable on days when they are only a pixel tall. Highlighting a front series and the low view keep the 0.9 colors. A theme given as a partial object takes the two colors from its base; a full `ChartTheme` written by hand needs the two new fields.\n\nNew in 0.9.0: `SkylineChart` looks down on its floor by default (`view: \"high\"`), so the smaller outcome in front (failures, retries) reads as a row of tiles even on days when it is only a few pixels tall. Periods stay on a level axis, so a taller block always means more. `view: \"low\"` keeps the 0.8 look, which leaves more room for the value scale. `depth` runs from 0.1 to 0.45 in the high view (default 0.42) and from 0.1 to 0.32 in the low view (default 0.32).\n\nData helpers: `useChartData` loads a URL or an async function and reports loading, error and empty states. `parseCSV`, `fromRows`, `fromObjects` and `melt` reshape tables. `percentiles(rows, { by: \"minute\", value: \"ms\" })` turns raw samples into `p50`, `p95` and `p99` rows for a latency chart.\n\nCard and tooltip helpers: `DownloadButtons` adds CSV, SVG and PNG download buttons to a card, and `templateTooltip(\"{label} · {value} · {owner}\")` shows other columns of the row in the tooltip.\n\nDiverging bars: `layout: \"diverging\"` on `BarChart` stacks the `negative` series left of a zero line and the rest to the right, for Likert surveys, for-and-against splits and population pyramids. `neutral` splits one series across the line, and `percent` shows each segment as a share of its row.\n\nMaps: `Choropleth` shades regions by value, `SymbolMap` puts a circle sized by value at each place, and `FlowMap` draws curved arrows from place to place. `map` defaults to `\"auto\"`, which picks the registered map that matches the most regions in your data: `world` (ISO codes or country names), `us-states` or `kr-sido`. A map object or your own GeoJSON FeatureCollection works too. In the browser, register the maps you draw:\n\n```tsx\nimport { Choropleth, registerMap } from \"ztd-charts\";\nimport { world } from \"ztd-charts/geo/world\";\n\nregisterMap(world);\n\nconst users = [\n { country: \"BRA\", users: 412 },\n { country: \"DEU\", users: 268 },\n { country: \"IND\", users: 530 },\n { country: \"USA\", users: 655 },\n];\n\nexport const UsersByCountry = () => ;\n```\n\n`ztd-charts/server`, the CLI and the MCP server draw `\"map\": \"world\"` with no setup. `focus: \"europe\"` crops the world map, and `center: \"pacific\"` on the symbol and flow maps puts the Pacific in the middle, so Shanghai to Los Angeles draws as one line. `FlowMap` reads the same `source`, `target` and `value` rows as `SankeyChart`, with places as region names or `places: { Shanghai: [121.5, 31.2] }`. The boundary data adds about 25 kB Brotli for the world, 11 kB for the US and 5 kB for Korea; its sources and licences are in `NOTICE.md`.\n\nTile grid map: `TileMap` draws one equal tile per region, shaded by its value, so Rhode Island reads as large as Texas. It ships the 50 US states and DC (`us-states`), Korea's 16 regions from July 2026 (`kr-sido`) and the 17 before the merger (`kr-sido-2025`), picks one from the data with `\"auto\"`, or takes your own tiles; `resolveGrid`, `tileMatcher`, `tileNeighbor` and `TILE_MAPS` expose the grids and name matching.\n\nMore new charts: `Tree` draws a hierarchy as linked dots, horizontal or radial, from nested rows or `id` and `parent` columns. `Timeline` draws one bar per item from `start` to `end`, for schedules, job runs and incidents. `NetworkChart` shows who connects to whom as arcs over one line, from the same rows as the sankey. `BarRace` steps through time with the top bars re-sorting at each step, with play, pause and a frame slider. `stratify`, `networkGraph`, `readTimeline`, `timelineRows` and `formatDuration` expose their layouts and the duration format.\n\nNew options: `shape: \"arc\"` on `WaffleChart` draws a seat chart in half-circle rows, one dot per seat, with `total` for empty seats and `referenceLines` for a majority. `bin: \"hex\"` on `ScatterChart` counts dense points into hexagons shaded by count, for 100,000 points and more.\n\nSize limits: a spec's `width` and `height` are at most 10,000 px (`MAX_CHART_SIZE` in `ztd-charts/spec`). `validateSpec` rejects more, and server rendering clamps sizes that skip validation, so a spec cannot make a server allocate without limit.\n\nSmall multiples: `facet: { by: \"region\" }` on a line, area, bar or scatter spec draws the same chart once per group on a shared scale, and `` does the same in React. Each component has a matching props type (`ChoroplethProps`, `TileMapProps`, `ChartFacetsProps` and so on), and `GeoMap`, `TileDef`, `SpecFacet`, `FacetType` and `FacetScale` are exported too.\n\nESM with `sideEffects: false`, so only the charts you import end up in your bundle.\n\n## Related packages\n\n- [ztd-charts-cli](https://www.npmjs.com/package/ztd-charts-cli): validate specs and render them to PNG, SVG or HTML from the terminal.\n- [ztd-charts-mcp](https://www.npmjs.com/package/ztd-charts-mcp): an MCP server so an AI agent can pick, check and render charts.\n\n## License\n\nMIT. Renamed from `@junhanlee/chart-kit` in 0.2.0: CSS names moved from `--ck-*`, `.ck-*` and `data-ck-theme` to `--ztd-*`, `.ztd-*` and `data-ztd-theme`.\n","readmeFilename":"README.md"}